Join the Conversation
- Find Answers
- :
- Using Splunk
- :
- Dashboards & Visualizations
- :
- How create line chart showing the count for Curren...
- Subscribe to RSS Feed
- Mark Topic as New
- Mark Topic as Read
- Float this Topic for Current User
- Bookmark Topic
- Subscribe to Topic
- Mute Topic
- Printer Friendly Page
- Mark as New
- Bookmark Message
- Subscribe to Message
- Mute Message
- Subscribe to RSS Feed
- Permalink
- Report Inappropriate Content
Hi Team,
I am planning to draw the trend of the webpage test speed index trend in Splunk which gives the performance of the speed index for the current week, last week, and last before week. I developed the below query to do the job, but I am not getting the trend and query giving some error. Can someone please help me to draw the trend?
index=nextgen sourcetype=lighthouse_json sourcetype=lighthouse_json datasource=webpagetest step="Homepage"
| eval myTime=case(test >= relative_time(now(), "-7d"), "CurrentWeek", test >= relative_time(now(), "-14d") AND test < relative_time(now(), "-7d", "PriorWeek", test >= relative_time(now(), "-21d") AND test < relative_time(now(), "-14d", "ThirdWeek", 1=1, "Other")
| stats  values(speedindex) as score by myTime
| eval fast = if(score>0 AND score<2000,score,0)
| eval moderate = if(score>=2000 AND score<2999,score,0)
| eval slow = if(score>=3000,score,0)
| fields - score
- Mark as New
- Bookmark Message
- Subscribe to Message
- Mute Message
- Subscribe to RSS Feed
- Permalink
- Report Inappropriate Content
I could get data week wise using "timewrap" function in splunk.
index=nextgen sourcetype=lighthouse_json sourcetype=lighthouse_json datasource=webpagetest step="Homepage" earliest=-21d@d | timechart span=1h list(speedindex) as score | timewrap wSource - https://docs.splunk.com/Documentation/Splunk/8.2.0/SearchReference/Timewrap
- Mark as New
- Bookmark Message
- Subscribe to Message
- Mute Message
- Subscribe to RSS Feed
- Permalink
- Report Inappropriate Content
| stats values(speedindex) as score by myTime
This returns a multi-value field of all the unique scores in the time period. Is that what you were expecting?
- Mark as New
- Bookmark Message
- Subscribe to Message
- Mute Message
- Subscribe to RSS Feed
- Permalink
- Report Inappropriate Content
I modified the query to get speed index values as per the week
index=nextgen sourcetype=lighthouse_json sourcetype=lighthouse_json datasource=webpagetest step="Homepage" earliest=-7d@d
| eval myTime=case(_time >= relative_time(now(), "-7d"), "CurrentWeek", _time >= relative_time(now(), "-14d") AND _time < relative_time(now(), "-7d"), "PriorWeek", _time >= relative_time(now(), "-21d") AND _time < relative_time(now(), "-14d"), "ThirdWeek", 1=1, "Other")
| stats  values(speedindex) as score by myTime
Now i am getting data in the statistics panel as below.
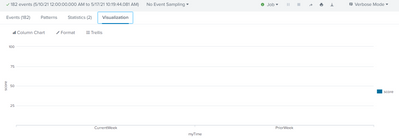
But i am not getting any trend in the visualization panel.
- Mark as New
- Bookmark Message
- Subscribe to Message
- Mute Message
- Subscribe to RSS Feed
- Permalink
- Report Inappropriate Content
I got to know that "values" function is giving results as a string, that's the reason I am not getting any trend.
index=nextgen sourcetype=lighthouse_json sourcetype=lighthouse_json datasource=webpagetest step="Homepage" earliest=-7d@d
| eval myTime=case(_time >= relative_time(now(), "-7d"), "CurrentWeek", _time >= relative_time(now(), "-14d") AND _time < relative_time(now(), "-7d"), "PriorWeek", _time >= relative_time(now(), "-21d") AND _time < relative_time(now(), "-14d"), "ThirdWeek", 1=1, "Other")
| stats  values(speedindex) as score by myTime
Can you please tell me instead of "values", which function i can use to get the trend?
- Mark as New
- Bookmark Message
- Subscribe to Message
- Mute Message
- Subscribe to RSS Feed
- Permalink
- Report Inappropriate Content
I could get data week wise using "timewrap" function in splunk.
index=nextgen sourcetype=lighthouse_json sourcetype=lighthouse_json datasource=webpagetest step="Homepage" earliest=-21d@d | timechart span=1h list(speedindex) as score | timewrap wSource - https://docs.splunk.com/Documentation/Splunk/8.2.0/SearchReference/Timewrap


