Are you a member of the Splunk Community?
- Find Answers
- :
- Using Splunk
- :
- Dashboards & Visualizations
- :
- Re: How can I change Splunk Dashboard single value...
- Subscribe to RSS Feed
- Mark Topic as New
- Mark Topic as Read
- Float this Topic for Current User
- Bookmark Topic
- Subscribe to Topic
- Mute Topic
- Printer Friendly Page
- Mark as New
- Bookmark Message
- Subscribe to Message
- Mute Message
- Subscribe to RSS Feed
- Permalink
- Report Inappropriate Content
Hi,
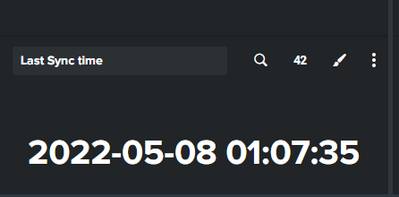
I have created a dashboard which shows the latest time of synching data between the two systems. Now I am interested to get the date color changed example: green(if sync time and current time difference is less than 1 hour) and red (if sync time and current time difference is more than 2 hour).
Is anything like that possible ?
In the format visualization as far as I am seeing it I can change the color only for the single value and not for the datetime format.
Please anyone can assist. Below is the how my date format looks
- Mark as New
- Bookmark Message
- Subscribe to Message
- Mute Message
- Subscribe to RSS Feed
- Permalink
- Report Inappropriate Content
The xml I gave was for a dashboard, not a search query. For a search query use
| makeresults
          | eval count=random()%20
          | eval msg=case(count <= 5, "Unsuccessful", count > 15, "Successful", 1==1, "Middling")
          | eval range=case(count < 4, "severe", count < 8, "high", count < 12, "elevated", count < 16, "guarded", 1==1, "low")
| table msg range- Mark as New
- Bookmark Message
- Subscribe to Message
- Mute Message
- Subscribe to RSS Feed
- Permalink
- Report Inappropriate Content
Perfect. Thank you so much sorted.
This is how its looking -
example -
<dashboard script="table_row_highlighting.js" stylesheet="table_decorations.css">
<label>Table Row Color based on String Time Duration in HH:MM:SS</label>
<row>
<panel>
<single id="success">
<title>Success</title>
<search>
<query>index=kafka kafka_topic="*events*filter*sink" message.source="*velocloud*"
| eval LatestTime=strftime(_time,"%Y-%m-%d %H:%M:%S")
| eval TimeDiff=round((now()-_time)/60)
| eval msg = case(TimeDiff >=59, "Delayed", TimeDiff < 10, "Successful", 1=1, "Middling")
| eval range= case(TimeDiff > 90, "severe", TimeDiff > 59, "high", TimeDiff > 30, "elevated", TimeDiff < 10, "guarded", 1==1, "low")
| table LatestTime TimeDiff msg range</query>
<earliest>-24h@h</earliest>
<latest>now</latest>
</search>
<option name="colorBy">value</option>
<option name="drilldown">none</option>
<option name="rangeColors">["red", "orange", "yellow", "blue","green"]</option>
<option name="refresh.display">progressbar</option>
<option name="trellis.enabled">0</option>
</single>
</panel>
</row>
</dashboard>
- Mark as New
- Bookmark Message
- Subscribe to Message
- Mute Message
- Subscribe to RSS Feed
- Permalink
- Report Inappropriate Content
Try adding an extra field called range with "low" or "severe" (or "high", or "elevated", or "guarded") depending on the time difference and use the colorBy and rangeColors options. Here is a runanywhere example.
<single id="success">
<title>Success</title>
<search>
<query>| makeresults
| eval count=random()%20
| eval msg=case(count <= 5, "Unsuccessful", count > 15, "Successful", 1==1, "Middling")
| eval range=case(count < 4, "severe", count < 8, "high", count < 12, "elevated", count < 16, "guarded", 1==1, "low")
| table msg range</query>
<earliest>-24h@h</earliest>
<latest>now</latest>
</search>
<option name="colorBy">value</option>
<option name="drilldown">none</option>
<option name="rangeColors">["red", "orange", "yellow", "blue","green"]</option>
<option name="refresh.display">progressbar</option>
<option name="trellis.enabled">0</option>
</single>
</panel>- Mark as New
- Bookmark Message
- Subscribe to Message
- Mute Message
- Subscribe to RSS Feed
- Permalink
- Report Inappropriate Content
@ITWhisperer Thank you for the quick turnaround. But when I run the query that you provided its giving me these error. I am using Splunk Enterprise version 8.2.1
- Mark as New
- Bookmark Message
- Subscribe to Message
- Mute Message
- Subscribe to RSS Feed
- Permalink
- Report Inappropriate Content
The xml I gave was for a dashboard, not a search query. For a search query use
| makeresults
          | eval count=random()%20
          | eval msg=case(count <= 5, "Unsuccessful", count > 15, "Successful", 1==1, "Middling")
          | eval range=case(count < 4, "severe", count < 8, "high", count < 12, "elevated", count < 16, "guarded", 1==1, "low")
          | table msg range


