Are you a member of the Splunk Community?
- Find Answers
- :
- Using Splunk
- :
- Dashboards & Visualizations
- :
- Re: Firewall Policy bandwidth usage is higher in S...
- Subscribe to RSS Feed
- Mark Topic as New
- Mark Topic as Read
- Float this Topic for Current User
- Bookmark Topic
- Subscribe to Topic
- Mute Topic
- Printer Friendly Page
- Mark as New
- Bookmark Message
- Subscribe to Message
- Mute Message
- Subscribe to RSS Feed
- Permalink
- Report Inappropriate Content
Hi all,
I've set up Splunk to receive Fortigate logs according to the guide on https://www.fortinet.com/content/dam/fortinet/assets/alliances/Fortinet-Splunk-Deployment-Guide.pdf
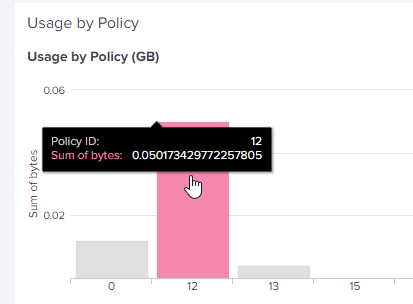
I've also set up a custom dashboard to make sure I'm receiving events properly. Eg: this widget is supposed to count data usage on each policy.
index="main" (eventtype=ftnt_fgt_traffic) |eval sum(bytes) = bytes | eval bytes = bytes/(1024*1024*1024) | rename bytes AS RootObject.bytes policyid AS RootObject.policyid | fields "_time" "host" "source" "sourcetype" "RootObject.bytes" "RootObject.policyid" | stats dedup_splitvals=t sum(RootObject.bytes) AS "Sum of bytes" by RootObject.policyid | sort limit=0 RootObject.policyid | fields - _span | rename RootObject.policyid AS "Policy ID" | fields "Policy ID", "Sum of bytes"
What I've noticed is that the bandwidth it shows on Splunk is higher than what it shows on Fortigate policy.
Can someone advise me on what I am doing wrong and how to fix this? Let me know if you need any additional information.
Splunk Enterprise Version:8.1.2 Build:545206cc9f70
Thank you!
- Shenath
- Mark as New
- Bookmark Message
- Subscribe to Message
- Mute Message
- Subscribe to RSS Feed
- Permalink
- Report Inappropriate Content
Answering my own question for anyone else who has this issue with Fortigate FW logs on Splunk,
This is not caused by duplicate logs but rather by how Fortigate handles long lived sessions. Apparently it sends interim logs which has rcvdbytes and sentbytes fields in the middle of a session. Fortigate calculates the usage properly by excluding these events but when we manually calculate we have to exclude them.
Easiest solution would be to disable interim logs on Fortigate.
This is an explanation of what is going on: https://docs.fortinet.com/document/fortianalyzer/6.2.0/new-features/902615/fortiview-long-lived-sess...
This is how to exclude interim logs on the Fortigate: https://kb.fortinet.com/kb/documentLink.do?externalID=FD43912

