- Find Answers
- :
- Using Splunk
- :
- Dashboards & Visualizations
- :
- Dashboard help -- Can I use Bootstrap Enterprise s...
- Subscribe to RSS Feed
- Mark Topic as New
- Mark Topic as Read
- Float this Topic for Current User
- Bookmark Topic
- Subscribe to Topic
- Mute Topic
- Printer Friendly Page
- Mark as New
- Bookmark Message
- Subscribe to Message
- Mute Message
- Subscribe to RSS Feed
- Permalink
- Report Inappropriate Content

I'm developing a home panel using the HTML components inside a panel in simple XML format.
Ex:
    <dashboard>
       <row>
          <panel>
             <html>
                ... my code here
             </html>
          </panel>
       </row>
    </dashboard>
What I need to do is make this control panel sensitive to other screen resolutions and mobile devices. I know that Splunk uses a modified version of the Bootstrap library, but I do not know which classes allow me to enable the same control panel in other resolutions.
Are there guides for the Enterprise Bootstrap version used by Splunk?
- Mark as New
- Bookmark Message
- Subscribe to Message
- Mute Message
- Subscribe to RSS Feed
- Permalink
- Report Inappropriate Content
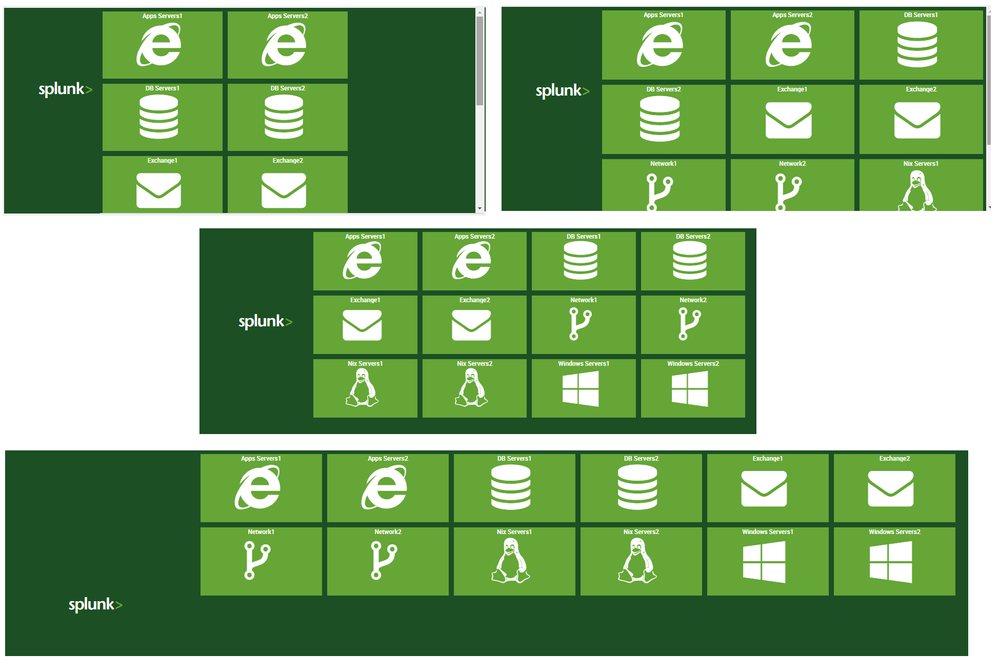
@markuxProof, while I can not comment on Grid based dashboards, please find attached the dashboard menu with Status Indicator Custom Visualization and Trellis Layout (Splunk Enterprise 6.6 onward). As you can see some examples below, it give 6, 4, 3 and 2 columns based on size of browser.
While I have used Status Indicator just for bare-bones example, you can use your web app development skills to create your own icons/background image etc. to develop the app layout you need.
Following is the Simple XML code for your reference.
PS: Splunkbase link for Status Indicator Custom Visualization (https://splunkbase.splunk.com/app/3119/).
Drilldown has to be coded via JavaScript.
<dashboard hideTitle="true" hideEdit="true" hideAppBar="true" hideSplunkBar="true" hideFooter="true">
  <label>Dashboard Menu Using Status Indicator and Trellis</label>
  <row depends="$alwaysHideCSSStyle$">
    <panel>
      <html>
        <style>
          #splunkLogoPanel{
            width:20% !important;
          }
          #splunkLogoPanel .panel-element-row{
            padding-top: 75% !important;
            padding-left: 30% !important;
          }
          #splunkDashboardsPanel{
            width:80% !important;
          }
          .dashboard-body{
            background-color:#1c4f24 !important;
          }
          .dashboard-panel{
            background-color:#1c4f24 !important;
            margin: 0 0px 0px 0 !important;
          }
          .viz-panel .facet-label {
              margin-bottom: -15px !important;
              color: #fff !important;
          }
          .facets-container .viz-facet {
              padding: 10px 5px 0px !important;
          }
          .ui-resizable-handle,.action-bar,.menus {
            visibility:hidden !important;
          }
        </style>
      </html>
    </panel>
  </row>
  <row>
    <panel id="splunkLogoPanel">
      <html>
        <i class="icon-splunk" style="font-size:250%;color:#fff;"></i><i class="icon-greater" style="font-size:250%;color:#65a637;"></i>
      </html>
    </panel>
    <panel id="splunkDashboardsPanel">
      <viz type="status_indicator_app.status_indicator">
        <search>
          <query>| makeresults
| eval data="Windows Servers1,windows,#65a637;Nix Servers1,linux,#65a637;DB Servers1,database,#65a637;Apps Servers1,internet-explorer,#65a637;Network1,code-fork,#65a637;Exchange1,envelope,#65a637;Windows Servers2,windows,#65a637;Nix Servers2,linux,#65a637;DB Servers2,database,#65a637;Apps Servers2,internet-explorer,#65a637;Network2,code-fork,#65a637;Exchange2,envelope,#65a637"
| makemv data delim=";"
| mvexpand data
| eval data=split(data,",")
| eval panel=mvindex(data,0), icon=mvindex(data,1), color=mvindex(data,2)
| table panel icon color
| stats count values(icon) as icon values(color) as color by panel</query>
          <earliest>-24h@h</earliest>
          <latest>now</latest>
          <sampleRatio>1</sampleRatio>
        </search>
        <option name="drilldown">none</option>
        <option name="status_indicator_app.status_indicator.colorBy">field_value</option>
        <option name="status_indicator_app.status_indicator.fillTarget">background</option>
        <option name="status_indicator_app.status_indicator.fixIcon">warning</option>
        <option name="status_indicator_app.status_indicator.icon">field_value</option>
        <option name="status_indicator_app.status_indicator.precision">0</option>
        <option name="status_indicator_app.status_indicator.showOption">2</option>
        <option name="status_indicator_app.status_indicator.staticColor">#555</option>
        <option name="status_indicator_app.status_indicator.useColors">true</option>
        <option name="status_indicator_app.status_indicator.useThousandSeparator">true</option>
        <option name="trellis.enabled">1</option>
        <option name="trellis.scales.shared">1</option>
        <option name="trellis.size">small</option>
        <option name="trellis.splitBy">panel</option>
        <option name="height">400</option>
      </viz>
    </panel>
  </row>
</dashboard>
| makeresults | eval message= "Happy Splunking!!!"
- Mark as New
- Bookmark Message
- Subscribe to Message
- Mute Message
- Subscribe to RSS Feed
- Permalink
- Report Inappropriate Content
Hey @markuxProof, if they solved your problem, remember to "√Accept" an answer to award karma points 🙂
- Mark as New
- Bookmark Message
- Subscribe to Message
- Mute Message
- Subscribe to RSS Feed
- Permalink
- Report Inappropriate Content
@markuxProof, while I can not comment on Grid based dashboards, please find attached the dashboard menu with Status Indicator Custom Visualization and Trellis Layout (Splunk Enterprise 6.6 onward). As you can see some examples below, it give 6, 4, 3 and 2 columns based on size of browser.
While I have used Status Indicator just for bare-bones example, you can use your web app development skills to create your own icons/background image etc. to develop the app layout you need.
Following is the Simple XML code for your reference.
PS: Splunkbase link for Status Indicator Custom Visualization (https://splunkbase.splunk.com/app/3119/).
Drilldown has to be coded via JavaScript.
<dashboard hideTitle="true" hideEdit="true" hideAppBar="true" hideSplunkBar="true" hideFooter="true">
  <label>Dashboard Menu Using Status Indicator and Trellis</label>
  <row depends="$alwaysHideCSSStyle$">
    <panel>
      <html>
        <style>
          #splunkLogoPanel{
            width:20% !important;
          }
          #splunkLogoPanel .panel-element-row{
            padding-top: 75% !important;
            padding-left: 30% !important;
          }
          #splunkDashboardsPanel{
            width:80% !important;
          }
          .dashboard-body{
            background-color:#1c4f24 !important;
          }
          .dashboard-panel{
            background-color:#1c4f24 !important;
            margin: 0 0px 0px 0 !important;
          }
          .viz-panel .facet-label {
              margin-bottom: -15px !important;
              color: #fff !important;
          }
          .facets-container .viz-facet {
              padding: 10px 5px 0px !important;
          }
          .ui-resizable-handle,.action-bar,.menus {
            visibility:hidden !important;
          }
        </style>
      </html>
    </panel>
  </row>
  <row>
    <panel id="splunkLogoPanel">
      <html>
        <i class="icon-splunk" style="font-size:250%;color:#fff;"></i><i class="icon-greater" style="font-size:250%;color:#65a637;"></i>
      </html>
    </panel>
    <panel id="splunkDashboardsPanel">
      <viz type="status_indicator_app.status_indicator">
        <search>
          <query>| makeresults
| eval data="Windows Servers1,windows,#65a637;Nix Servers1,linux,#65a637;DB Servers1,database,#65a637;Apps Servers1,internet-explorer,#65a637;Network1,code-fork,#65a637;Exchange1,envelope,#65a637;Windows Servers2,windows,#65a637;Nix Servers2,linux,#65a637;DB Servers2,database,#65a637;Apps Servers2,internet-explorer,#65a637;Network2,code-fork,#65a637;Exchange2,envelope,#65a637"
| makemv data delim=";"
| mvexpand data
| eval data=split(data,",")
| eval panel=mvindex(data,0), icon=mvindex(data,1), color=mvindex(data,2)
| table panel icon color
| stats count values(icon) as icon values(color) as color by panel</query>
          <earliest>-24h@h</earliest>
          <latest>now</latest>
          <sampleRatio>1</sampleRatio>
        </search>
        <option name="drilldown">none</option>
        <option name="status_indicator_app.status_indicator.colorBy">field_value</option>
        <option name="status_indicator_app.status_indicator.fillTarget">background</option>
        <option name="status_indicator_app.status_indicator.fixIcon">warning</option>
        <option name="status_indicator_app.status_indicator.icon">field_value</option>
        <option name="status_indicator_app.status_indicator.precision">0</option>
        <option name="status_indicator_app.status_indicator.showOption">2</option>
        <option name="status_indicator_app.status_indicator.staticColor">#555</option>
        <option name="status_indicator_app.status_indicator.useColors">true</option>
        <option name="status_indicator_app.status_indicator.useThousandSeparator">true</option>
        <option name="trellis.enabled">1</option>
        <option name="trellis.scales.shared">1</option>
        <option name="trellis.size">small</option>
        <option name="trellis.splitBy">panel</option>
        <option name="height">400</option>
      </viz>
    </panel>
  </row>
</dashboard>
| makeresults | eval message= "Happy Splunking!!!"
- Mark as New
- Bookmark Message
- Subscribe to Message
- Mute Message
- Subscribe to RSS Feed
- Permalink
- Report Inappropriate Content
Niketnilay,
Dude, your response was perfect. It was even better than I was thinking. I already knew Trellis Layout, but it did not even occur to me to use it here.
Thank you very much!
- Mark as New
- Bookmark Message
- Subscribe to Message
- Mute Message
- Subscribe to RSS Feed
- Permalink
- Report Inappropriate Content
@markuxProof, anytime! Glad it worked. Do let us know if something further is required.
| makeresults | eval message= "Happy Splunking!!!"
- Mark as New
- Bookmark Message
- Subscribe to Message
- Mute Message
- Subscribe to RSS Feed
- Permalink
- Report Inappropriate Content
@markuxProof, you can get Splunk Style guide at the following path based on your Splunk Server name and port.
http://<YourSplunkServer>/en-US/static/docs/style/style-guide.html
If you have local instance
http://localhost:8000/en-US/static/docs/style/style-guide.html
| makeresults | eval message= "Happy Splunking!!!"
- Mark as New
- Bookmark Message
- Subscribe to Message
- Mute Message
- Subscribe to RSS Feed
- Permalink
- Report Inappropriate Content
hi niketnilay,
Thans for answer. I had already accessed this inlay session to see if what I was looking for was described. But what I really need is something like Bootstrap's grid system (https://getbootstrap.com/docs/3.3/css/#grid)
- Mark as New
- Bookmark Message
- Subscribe to Message
- Mute Message
- Subscribe to RSS Feed
- Permalink
- Report Inappropriate Content
Could you describe more your request?
Bye.
Giuseppe
- Mark as New
- Bookmark Message
- Subscribe to Message
- Mute Message
- Subscribe to RSS Feed
- Permalink
- Report Inappropriate Content
hi Cusello,
I will update this post in more detail.

