Turn on suggestions
Auto-suggest helps you quickly narrow down your search results by suggesting possible matches as you type.
Dashboards & Visualizations
×
Are you a member of the Splunk Community?
Sign in or Register with your Splunk account to get your questions answered, access valuable resources and connect with experts!
Turn on suggestions
Auto-suggest helps you quickly narrow down your search results by suggesting possible matches as you type.
- Find Answers
- :
- Using Splunk
- :
- Dashboards & Visualizations
- :
- Dashboard customization - change 500, 504 to 5xx c...
Options
- Subscribe to RSS Feed
- Mark Topic as New
- Mark Topic as Read
- Float this Topic for Current User
- Bookmark Topic
- Subscribe to Topic
- Mute Topic
- Printer Friendly Page
- Mark as New
- Bookmark Message
- Subscribe to Message
- Mute Message
- Subscribe to RSS Feed
- Permalink
- Report Inappropriate Content
cmarrott
Explorer
06-30-2021
11:28 AM
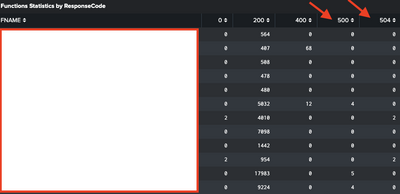
500 and 504 are shown here - but i'd like to condense them to one column="5xx" (same with 400, where all 4% responses would be shown under "4xx"
    <panel>
      <table>
        <title>Functions Statistics by ResponseCode</title>
        <search base="base_search3">
          <query>
            stats sum(count) as Count sum(S) as Success sum(F) as Failures avg(Avg_ResponseTime) as Average_ResponseTime by _time FNAME CODE |
            eval Availability=(Success/(Success+Failures))*100 |
            chart count by FNAME CODE
          </query>
        </search>
        <option name="count">15</option>
        <option name="drilldown">none</option>
        <option name="refresh.display">progressbar</option>
      </table>
    </panel>
the above is the relevant code
1 Solution
- Mark as New
- Bookmark Message
- Subscribe to Message
- Mute Message
- Subscribe to RSS Feed
- Permalink
- Report Inappropriate Content
richgalloway

SplunkTrust
06-30-2021
11:45 AM
Use eval to normalize the error codes before counting them.
<panel>
      <table>
        <title>Functions Statistics by ResponseCode</title>
        <search base="base_search3">
          <query>
            eval CODE=case(CODE/100=5, "5xx", CODE/100=4, "4xx", CODE/100=2, "2xx", 1==1,CODE)
            | stats sum(count) as Count sum(S) as Success sum(F) as Failures avg(Avg_ResponseTime) as Average_ResponseTime by _time FNAME CODE |
            eval Availability=(Success/(Success+Failures))*100 |
            chart count by FNAME CODE
          </query>
        </search>
        <option name="count">15</option>
        <option name="drilldown">none</option>
        <option name="refresh.display">progressbar</option>
      </table>
    </panel>
---
If this reply helps you, Karma would be appreciated.
If this reply helps you, Karma would be appreciated.
- Mark as New
- Bookmark Message
- Subscribe to Message
- Mute Message
- Subscribe to RSS Feed
- Permalink
- Report Inappropriate Content
richgalloway

SplunkTrust
06-30-2021
11:45 AM
Use eval to normalize the error codes before counting them.
<panel>
      <table>
        <title>Functions Statistics by ResponseCode</title>
        <search base="base_search3">
          <query>
            eval CODE=case(CODE/100=5, "5xx", CODE/100=4, "4xx", CODE/100=2, "2xx", 1==1,CODE)
            | stats sum(count) as Count sum(S) as Success sum(F) as Failures avg(Avg_ResponseTime) as Average_ResponseTime by _time FNAME CODE |
            eval Availability=(Success/(Success+Failures))*100 |
            chart count by FNAME CODE
          </query>
        </search>
        <option name="count">15</option>
        <option name="drilldown">none</option>
        <option name="refresh.display">progressbar</option>
      </table>
    </panel>
---
If this reply helps you, Karma would be appreciated.
If this reply helps you, Karma would be appreciated.
Career Survey
First 500 qualified respondents will receive a $20 gift card! Tell us about your professional Splunk journey.
Get Updates on the Splunk Community!
What Is Splunk? Here’s What You Can Do with Splunk
Hey Splunk Community, we know you know Splunk. You likely leverage its unparalleled ability to ingest, index, ...
Level Up Your .conf25: Splunk Arcade Comes to Boston
With .conf25 right around the corner in Boston, there’s a lot to look forward to — inspiring keynotes, ...
Manual Instrumentation with Splunk Observability Cloud: How to Instrument Frontend ...
Although it might seem daunting, as we’ve seen in this series, manual instrumentation can be straightforward ...

