Turn on suggestions
Auto-suggest helps you quickly narrow down your search results by suggesting possible matches as you type.
Showing results for
Dashboards & Visualizations
Turn on suggestions
Auto-suggest helps you quickly narrow down your search results by suggesting possible matches as you type.
Showing results for
- Splunk Answers
- :
- Using Splunk
- :
- Dashboards & Visualizations
- :
- Dashboard customization - change 500, 504 to 5xx c...
Options
- Subscribe to RSS Feed
- Mark Topic as New
- Mark Topic as Read
- Float this Topic for Current User
- Bookmark Topic
- Subscribe to Topic
- Mute Topic
- Printer Friendly Page
- Mark as New
- Bookmark Message
- Subscribe to Message
- Mute Message
- Subscribe to RSS Feed
- Permalink
- Report Inappropriate Content
cmarrott
Explorer
06-30-2021
11:28 AM
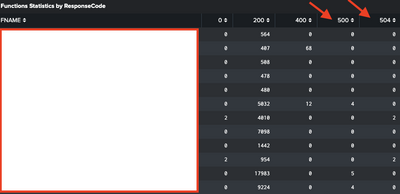
500 and 504 are shown here - but i'd like to condense them to one column="5xx" (same with 400, where all 4% responses would be shown under "4xx"
    <panel>
      <table>
        <title>Functions Statistics by ResponseCode</title>
        <search base="base_search3">
          <query>
            stats sum(count) as Count sum(S) as Success sum(F) as Failures avg(Avg_ResponseTime) as Average_ResponseTime by _time FNAME CODE |
            eval Availability=(Success/(Success+Failures))*100 |
            chart count by FNAME CODE
          </query>
        </search>
        <option name="count">15</option>
        <option name="drilldown">none</option>
        <option name="refresh.display">progressbar</option>
      </table>
    </panel>
the above is the relevant code
1 Solution
- Mark as New
- Bookmark Message
- Subscribe to Message
- Mute Message
- Subscribe to RSS Feed
- Permalink
- Report Inappropriate Content
richgalloway

SplunkTrust
06-30-2021
11:45 AM
Use eval to normalize the error codes before counting them.
<panel>
      <table>
        <title>Functions Statistics by ResponseCode</title>
        <search base="base_search3">
          <query>
            eval CODE=case(CODE/100=5, "5xx", CODE/100=4, "4xx", CODE/100=2, "2xx", 1==1,CODE)
            | stats sum(count) as Count sum(S) as Success sum(F) as Failures avg(Avg_ResponseTime) as Average_ResponseTime by _time FNAME CODE |
            eval Availability=(Success/(Success+Failures))*100 |
            chart count by FNAME CODE
          </query>
        </search>
        <option name="count">15</option>
        <option name="drilldown">none</option>
        <option name="refresh.display">progressbar</option>
      </table>
    </panel>
---
If this reply helps you, Karma would be appreciated.
If this reply helps you, Karma would be appreciated.
- Mark as New
- Bookmark Message
- Subscribe to Message
- Mute Message
- Subscribe to RSS Feed
- Permalink
- Report Inappropriate Content
richgalloway

SplunkTrust
06-30-2021
11:45 AM
Use eval to normalize the error codes before counting them.
<panel>
      <table>
        <title>Functions Statistics by ResponseCode</title>
        <search base="base_search3">
          <query>
            eval CODE=case(CODE/100=5, "5xx", CODE/100=4, "4xx", CODE/100=2, "2xx", 1==1,CODE)
            | stats sum(count) as Count sum(S) as Success sum(F) as Failures avg(Avg_ResponseTime) as Average_ResponseTime by _time FNAME CODE |
            eval Availability=(Success/(Success+Failures))*100 |
            chart count by FNAME CODE
          </query>
        </search>
        <option name="count">15</option>
        <option name="drilldown">none</option>
        <option name="refresh.display">progressbar</option>
      </table>
    </panel>
---
If this reply helps you, Karma would be appreciated.
If this reply helps you, Karma would be appreciated.
Get Updates on the Splunk Community!
Built-in Service Level Objectives Management to Bridge the Gap Between Service & ...
Wednesday, May 29, 2024 | 11AM PST / 2PM ESTRegister now and join us to learn more about how you can ...
Get Your Exclusive Splunk Certified Cybersecurity Defense Engineer Certification at ...
We’re excited to announce a new Splunk certification exam being released at .conf24! If you’re headed to Vegas ...
Share Your Ideas & Meet the Lantern team at .Conf! Plus All of This Month’s New ...
Splunk Lantern is Splunk’s customer success center that provides advice from Splunk experts on valuable data ...

