Turn on suggestions
Auto-suggest helps you quickly narrow down your search results by suggesting possible matches as you type.
Dashboards & Visualizations
×
Are you a member of the Splunk Community?
Sign in or Register with your Splunk account to get your questions answered, access valuable resources and connect with experts!
Turn on suggestions
Auto-suggest helps you quickly narrow down your search results by suggesting possible matches as you type.
- Find Answers
- :
- Using Splunk
- :
- Dashboards & Visualizations
- :
- Controlling X Axis major tick labels in area chart...
Options
- Subscribe to RSS Feed
- Mark Topic as New
- Mark Topic as Read
- Float this Topic for Current User
- Bookmark Topic
- Subscribe to Topic
- Mute Topic
- Printer Friendly Page
- Mark as New
- Bookmark Message
- Subscribe to Message
- Mute Message
- Subscribe to RSS Feed
- Permalink
- Report Inappropriate Content
Controlling X Axis major tick labels in area charts
chiliconbeano
Path Finder
08-11-2021
12:07 PM
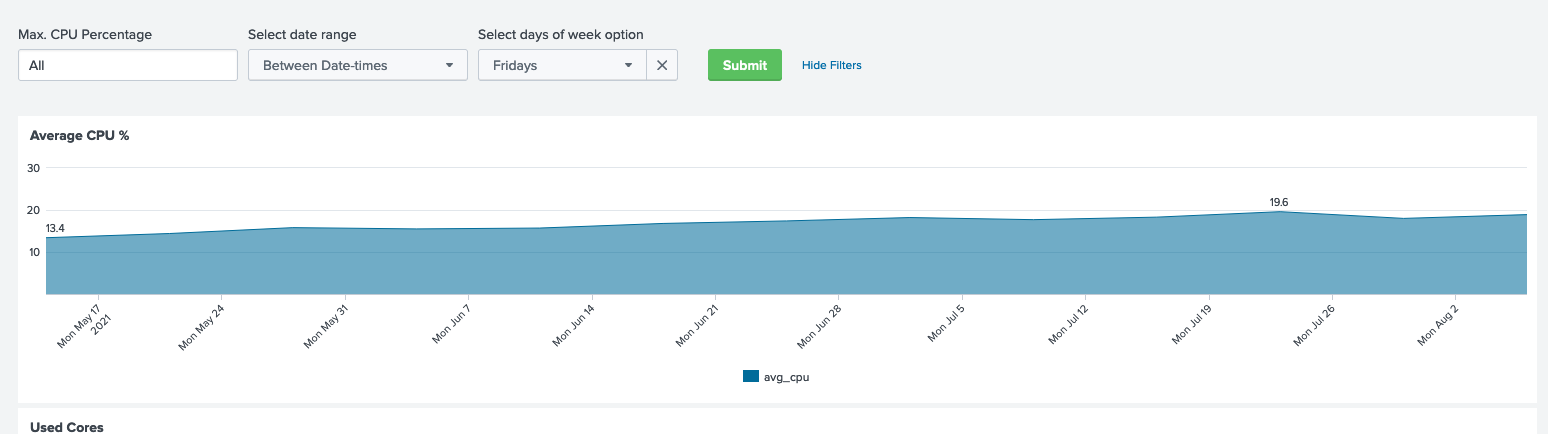
By default, when you chart by '_time', the major ticks displayed over a multiple week time span always uses Mondays in the major tick labels. Since I am allowing people to select individual days of the week for week over week comparisons, it would be nice to show the selected day of the week as the major tick label.
Is there a charting control variable that can be used for this?
thanks in advance,
Bob Eubanks
In the attached screen shot, the user has selected 'Fridays' for comparison, yet the chart uses Mondays as the major tick label.
Career Survey
First 500 qualified respondents will receive a $20 gift card! Tell us about your professional Splunk journey.
Get Updates on the Splunk Community!
Take Action Automatically on Splunk Alerts with Red Hat Ansible Automation Platform
Are you ready to revolutionize your IT operations? As digital transformation accelerates, the demand for ...
Calling All Security Pros: Ready to Race Through Boston?
Hey Splunkers,
.conf25 is heading to Boston and we’re kicking things off with something bold, competitive, and ...
Beyond Detection: How Splunk and Cisco Integrated Security Platforms Transform ...
Financial services organizations face an impossible equation: maintain 99.9% uptime for mission-critical ...
