Turn on suggestions
Auto-suggest helps you quickly narrow down your search results by suggesting possible matches as you type.
Showing results for
Dashboards & Visualizations
Turn on suggestions
Auto-suggest helps you quickly narrow down your search results by suggesting possible matches as you type.
Showing results for
- Find Answers
- :
- Using Splunk
- :
- Dashboards & Visualizations
- :
- Controlling X Axis major tick labels in area chart...
Options
- Subscribe to RSS Feed
- Mark Topic as New
- Mark Topic as Read
- Float this Topic for Current User
- Bookmark Topic
- Subscribe to Topic
- Mute Topic
- Printer Friendly Page
- Mark as New
- Bookmark Message
- Subscribe to Message
- Mute Message
- Subscribe to RSS Feed
- Permalink
- Report Inappropriate Content
Controlling X Axis major tick labels in area charts
chiliconbeano
Path Finder
08-11-2021
12:07 PM
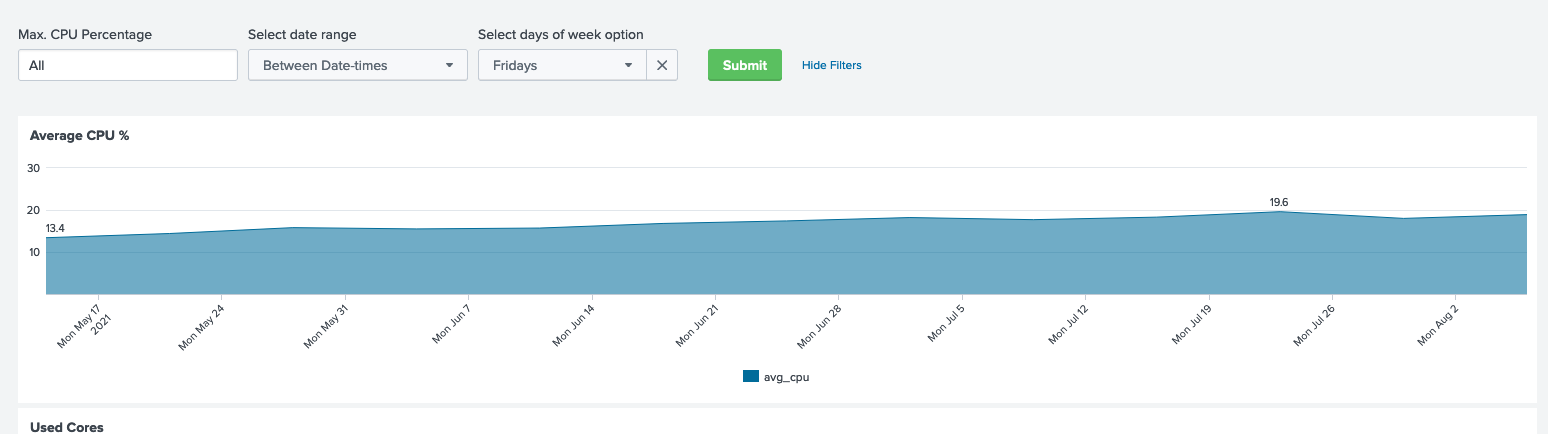
By default, when you chart by '_time', the major ticks displayed over a multiple week time span always uses Mondays in the major tick labels. Since I am allowing people to select individual days of the week for week over week comparisons, it would be nice to show the selected day of the week as the major tick label.
Is there a charting control variable that can be used for this?
thanks in advance,
Bob Eubanks
In the attached screen shot, the user has selected 'Fridays' for comparison, yet the chart uses Mondays as the major tick label.
Get Updates on the Splunk Community!
Let’s Talk Terraform
If you’re beyond the first-weeks-of-a-startup stage, chances are your application’s architecture is pretty ...
Cloud Platform | Customer Change Announcement: Email Notification is Available For ...
The Notification Team is migrating our email service provider. As the rollout progresses, Splunk has enabled ...
Save the Date: GovSummit Returns Wednesday, December 11th!
Hey there, Splunk Community!
Exciting news: Splunk’s GovSummit 2024 is returning to Washington, D.C. on ...
