
Join the Conversation
- Find Answers
- :
- Using Splunk
- :
- Dashboards & Visualizations
- :
- Re: Condensed multi-series chart
- Subscribe to RSS Feed
- Mark Topic as New
- Mark Topic as Read
- Float this Topic for Current User
- Bookmark Topic
- Subscribe to Topic
- Mute Topic
- Printer Friendly Page
- Mark as New
- Bookmark Message
- Subscribe to Message
- Mute Message
- Subscribe to RSS Feed
- Permalink
- Report Inappropriate Content

I have a speedtest from ookla that runs every 30 min and returns results from 3 servers.
2022-02-02T08:00:26.000-0300,94.02204,94.28108,NETSEG FIBRA
2022-02-02T08:00:51.000-0300,304.676784,153.272304,Oi
2022-02-02T08:01:17.000-0300,303.109696,151.48468,LinQ Telecom
2022-02-02T08:30:25.000-0300,94.107144,93.58704,NETSEG FIBRA
2022-02-02T08:30:49.000-0300,304.835216,153.044024,Oi
2022-02-02T08:31:16.000-0300,275.610992,153.0804,LinQ Telecom
Here is my search:
sourcetype="SpeedTest"
| convert num(download.bandwidth) as D_bnd
| convert num(upload.bandwidth) as U_bnd
| eval dmbs=D_bnd*8/1000000
| eval umbs=U_bnd*8/1000000
| table _time dmbs umbs
This is the basic result, I don't want to to an avg(dmbs) so timechart wont work that I am aware of.
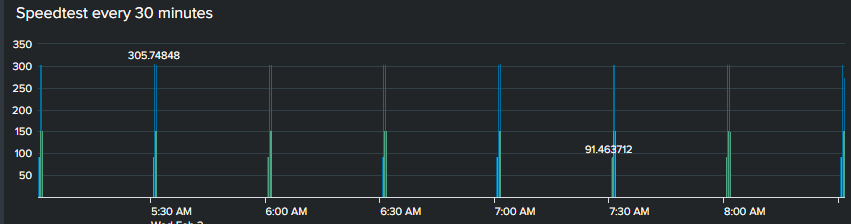
What I would like is to do like a span=30m to join these while showing a label for the server.name for each bar. Is this possible or do I have to make three chart searches then combine somehow?
Expected Result I am trying to make is like a time chart avg(dmbs) span=15 but with each server.name in series so I can overlay them or use the trellis layout and aggregate them on the server.name while still showing the up/down speed. i don't care if the up/down is side by side or stacked. The span will eliminate the gap between the times (30min).
I did this on one server.name and works fine but want to combine all three server.name in one chart in different x data points.

- Mark as New
- Bookmark Message
- Subscribe to Message
- Mute Message
- Subscribe to RSS Feed
- Permalink
- Report Inappropriate Content


Does this help?
| bin _time span=30m
| chart values(dmbs) as dmbs values(umbs) as umbs by _time server.name- Mark as New
- Bookmark Message
- Subscribe to Message
- Mute Message
- Subscribe to RSS Feed
- Permalink
- Report Inappropriate Content
Does this help?
| bin _time span=30m
| chart values(dmbs) as dmbs values(umbs) as umbs by _time server.name- Mark as New
- Bookmark Message
- Subscribe to Message
- Mute Message
- Subscribe to RSS Feed
- Permalink
- Report Inappropriate Content


Join the Splunk Community Slack to learn, troubleshoot, and make connections with fellow Splunk practitioners in real time!
Join Splunk User Groups to connect and learn in-person by region or remotely by topic or industry.
Cisco Data Fabric from Architecture to Investigation, Better SOC Visibility, and More ...
The Trust Gap: Why a Data Foundation is Fundamental to an Agentic Enterprise
Data Management Digest – September 2026
