
Join the Conversation
- Find Answers
- :
- Using Splunk
- :
- Dashboards & Visualizations
- :
- Re: CSS not working with Dashboard
- Subscribe to RSS Feed
- Mark Topic as New
- Mark Topic as Read
- Float this Topic for Current User
- Bookmark Topic
- Subscribe to Topic
- Mute Topic
- Printer Friendly Page
- Mark as New
- Bookmark Message
- Subscribe to Message
- Mute Message
- Subscribe to RSS Feed
- Permalink
- Report Inappropriate Content
CSS not working with Dashboard

I am using CustomDecorations.css for my dashboard how to add it with my panels.
.custom-result-value {
    font-size: 55px;
    margin: 35px auto;
    text-align: center;
    font-weight: bold;
    color: rgb(85, 85, 85);
}
.custom-result-value:before {
    font-family: "Splunk Icons";
    font-style: normal;
    font-weight: normal;
    text-decoration: inherit;
    font-size: 110%;
}
.severe.custom-result-value:before {
    content: "\2297";
}
.severe.custom-result-value {
    color: rgb(217, 63, 60);
}
.high.custom-result-value {
    color: rgb(245, 143, 57);
}
.high.custom-result-value:before {
    content: "\ECD4";
}
.elevated.custom-result-value {
    color: rgb(247, 188, 56);
}
.elevated.custom-result-value:before {
    content: "\26A0";
}
.low.custom-result-value {
    color: rgb(101, 166, 55);
}
.low.custom-result-value:before {
    content: "\ECD3";
}
.guarded.custom-result-value {
    color: rgb(109, 183, 198);
}
.guarded.custom-result-value:before {
    content: "\0049";
}
.custom-result-value.icon-only {
    font-size: 90px;
}
- Mark as New
- Bookmark Message
- Subscribe to Message
- Mute Message
- Subscribe to RSS Feed
- Permalink
- Report Inappropriate Content

@sathish2k8 please add more details as to what you are trying to implement.
In order to add CSS Splunk Dashboard there could be several ways... to begin with try to add the following to Simple XML dashboard:
<row depends="$alwaysHideCSSPanel$">
    <panel>
         <html>
               <style>
             .custom-result-value {
                 font-size: 55px;
                 margin: 35px auto;
                 text-align: center;
                 font-weight: bold;
                 color: rgb(85, 85, 85);
             }
             .custom-result-value:before {
                 font-family: "Splunk Icons";
                 font-style: normal;
                 font-weight: normal;
                 text-decoration: inherit;
                 font-size: 110%;
             }
             .severe.custom-result-value:before {
                 content: "\2297";
             }
             .severe.custom-result-value {
                 color: rgb(217, 63, 60);
             }
             .high.custom-result-value {
                 color: rgb(245, 143, 57);
             }
             .high.custom-result-value:before {
                 content: "\ECD4";
             }
             .elevated.custom-result-value {
                 color: rgb(247, 188, 56);
             }
             .elevated.custom-result-value:before {
                 content: "\26A0";
             }
             .low.custom-result-value {
                 color: rgb(101, 166, 55);
             }
             .low.custom-result-value:before {
                 content: "\ECD3";
             }
             .guarded.custom-result-value {
                 color: rgb(109, 183, 198);
             }
             .guarded.custom-result-value:before {
                 content: "\0049";
             }
             .custom-result-value.icon-only {
                 font-size: 90px;
             }
               </style>
         </html>
    </panel>
</row>
| makeresults | eval message= "Happy Splunking!!!"
- Mark as New
- Bookmark Message
- Subscribe to Message
- Mute Message
- Subscribe to RSS Feed
- Permalink
- Report Inappropriate Content
I have my dashboard full of single value fields. instead of showing single value i want to show icons as in the attachment. for that i tried to implement by adding progress add inside my panel but not working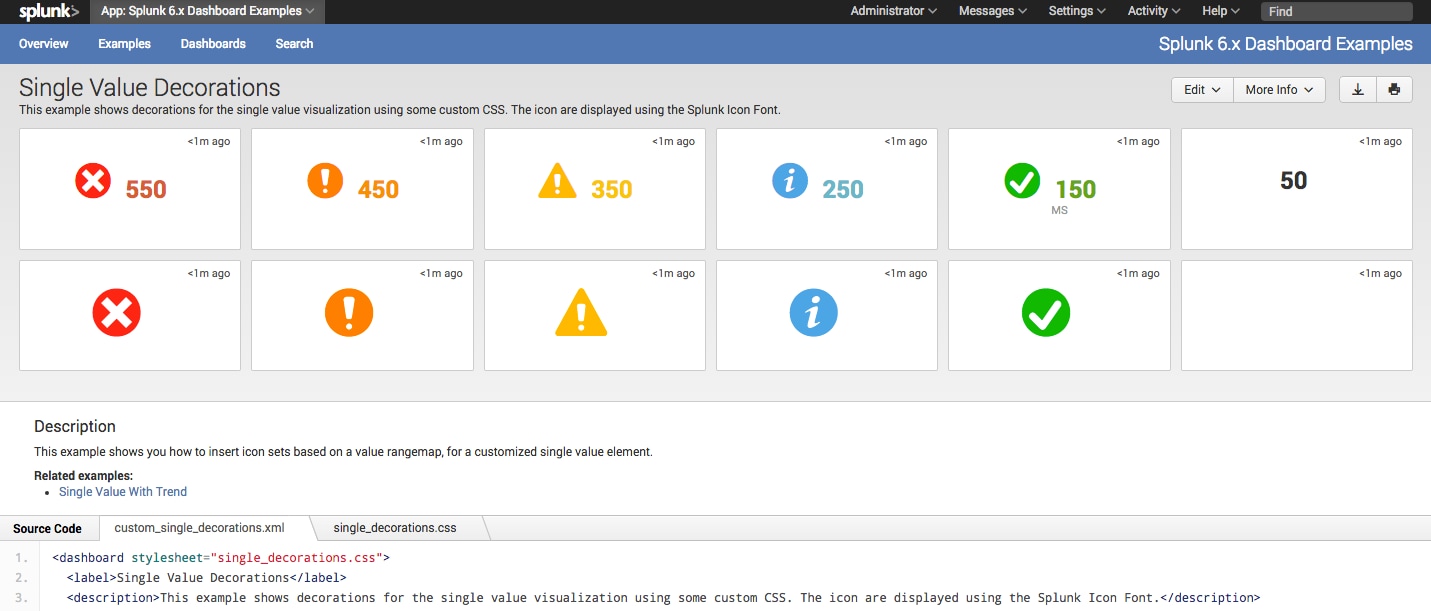 . above message has customdecorations css. Please guide me. i have presentation today. 😞
<label>Online Quotation</label>
<description>~</description>
<fieldset submitButton="false" autoRun="true">
<input type="time" token="field1">
<label></label>
<default>
<earliest>-24h@h</earliest>
<latest>now</latest>
</default>
</input>
</fieldset>
<row>
<panel>
<title>Profiler</title>
<single>
<search>
<query>index=<> sourcetype="profiler" timeout>5000| stats count</query>
<progress>
<set token="value3">$result.value$</set>
<set token="range3">$result.range$</set>
</progress>
<earliest>-15m</earliest>
<latest>now</latest>
<sampleRatio>1</sampleRatio>
</search>
<option name="drilldown">all</option>
<drilldown>
<link target="_blank">/app/gre/profiler</link>
</drilldown>
</single>
</panel>
<panel>
</row>
</form>
- Mark as New
- Bookmark Message
- Subscribe to Message
- Mute Message
- Subscribe to RSS Feed
- Permalink
- Report Inappropriate Content

Don't forget to restart your Splunk daemon. In earlier versions of Splunk, a restart was required before new stylesheets took effect.
Skalli
- Mark as New
- Bookmark Message
- Subscribe to Message
- Mute Message
- Subscribe to RSS Feed
- Permalink
- Report Inappropriate Content
@sathish2k8, if you need it ASAP, you should try to use Status Indicator custom visualization from Splunkbase: https://splunkbase.splunk.com/app/3119/
Refer to following answer to do something similar with Single Value visualization and Status Indicator Custom Visualization: https://answers.splunk.com/answers/590581/refresh-data-in-table-by-collecting-token-on-click.html
| makeresults | eval message= "Happy Splunking!!!"


Join the Splunk Community Slack to learn, troubleshoot, and make connections with fellow Splunk practitioners in real time!
Join Splunk User Groups to connect and learn in-person by region or remotely by topic or industry.
Free Professional Services for .conf26 Attendees
Defend at Machine Speed: Your Guide to Security Sessions at .conf26
Where Innovation Takes Flight: The Splunk4Aviation Flight Sim Lands at .conf26
