
Join the Conversation
- Find Answers
- :
- Using Splunk
- :
- Dashboards & Visualizations
- :
- Bar chart dashboard from JSON
- Subscribe to RSS Feed
- Mark Topic as New
- Mark Topic as Read
- Float this Topic for Current User
- Bookmark Topic
- Subscribe to Topic
- Mute Topic
- Printer Friendly Page
- Mark as New
- Bookmark Message
- Subscribe to Message
- Mute Message
- Subscribe to RSS Feed
- Permalink
- Report Inappropriate Content
Bar chart dashboard from JSON

I am looking to create a simple dashboard with fruit on the x-axis and amount on the y-axis based on the last event . When I try to list the amount, all the amounts get listed instead of the corresponding fruit. Any help or documentation is appreciated
{
"Results": [
{
"Fruit": "Apple",
"amount": 9
},
{
"Fruit": "Orange",
"amount": 37
},
{
"Model": "Cherry",
"Amount": 27
},
]
}
- Mark as New
- Bookmark Message
- Subscribe to Message
- Mute Message
- Subscribe to RSS Feed
- Permalink
- Report Inappropriate Content

Is this what you're looking for?
{
	"visualizations": {
		"viz_JWN1sI3B": {
			"type": "viz.column",
			"dataSources": {
				"primary": "ds_IsoS7KHW"
			}
		}
	},
	"dataSources": {
		"ds_IsoS7KHW": {
			"name": "fruits",
			"options": {
				"data": {
					"columns": [
						[
							"Apple",
							"Orange",
							"Cherry"
						],
						[
							9,
							37,
							27
						]
					],
					"fields": [
						{
							"name": "Fruit"
						},
						{
							"name": "Value"
						}
					]
				},
				"meta": {}
			},
			"type": "ds.test"
		}
	},
	"inputs": {},
	"layout": {
		"type": "absolute",
		"options": {
			"display": "auto-scale"
		},
		"structure": [
			{
				"item": "viz_JWN1sI3B",
				"type": "block",
				"position": {
					"x": 0,
					"y": 0,
					"w": 1090,
					"h": 410
				}
			}
		],
		"globalInputs": []
	},
	"description": "",
	"title": "Fruits"
}- Mark as New
- Bookmark Message
- Subscribe to Message
- Mute Message
- Subscribe to RSS Feed
- Permalink
- Report Inappropriate Content
Hey Ryan, thanks for the response. The dashboard you provided is the end goal. I'm just having difficulty with the search query that would pull the information from the last event into the columns to display apple with 9 on the bar chart.
- Mark as New
- Bookmark Message
- Subscribe to Message
- Mute Message
- Subscribe to RSS Feed
- Permalink
- Report Inappropriate Content
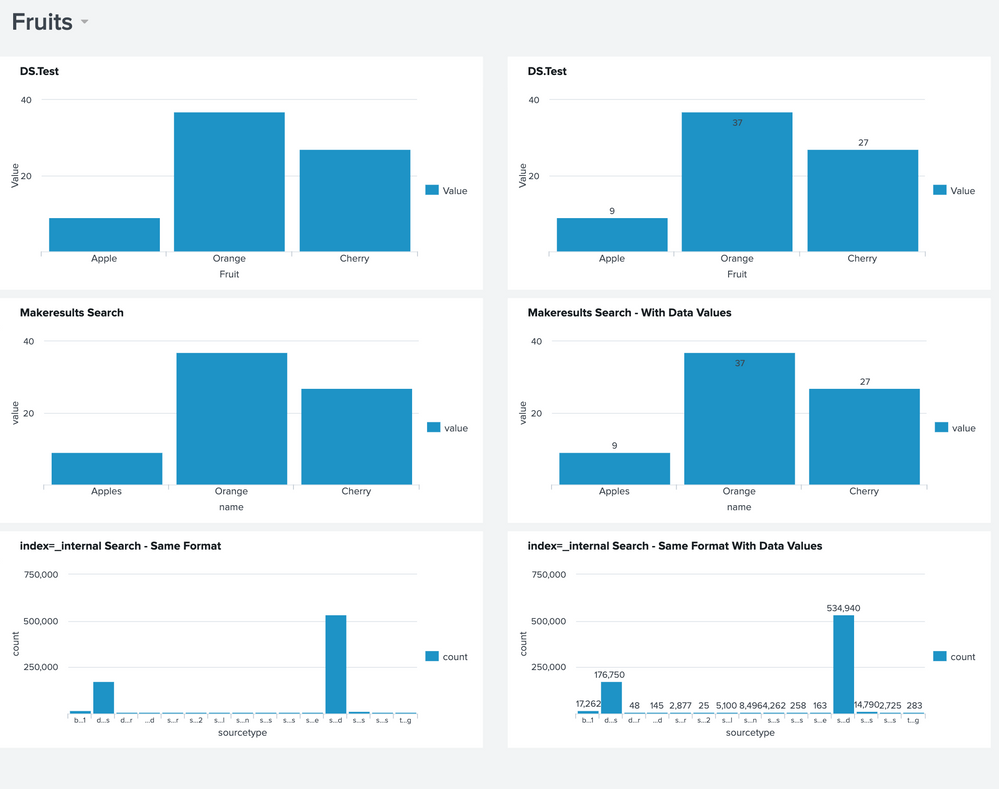
I think I understand what you're saying. So are you looking to format the results of a search in the same format? And Apple, Orange, Cherry are just examples?
If so, try this dashboard. I added a couple more charts and the searches and hoping one of them is what you're after.
{
	"visualizations": {
		"viz_JWN1sI3B": {
			"type": "viz.column",
			"dataSources": {
				"primary": "ds_IsoS7KHW"
			},
			"title": "DS.Test"
		},
		"viz_9ILmkyxt": {
			"type": "viz.column",
			"dataSources": {
				"primary": "ds_KPiUzObK"
			},
			"title": "index=_internal Search - Same Format"
		},
		"viz_vEOxS1st": {
			"type": "viz.column",
			"dataSources": {
				"primary": "ds_c5ml9k3I_ds_KPiUzObK"
			},
			"title": "Makeresults Search"
		},
		"viz_2F9srtYn": {
			"type": "viz.column",
			"dataSources": {
				"primary": "ds_aEbiKLuP_ds_c5ml9k3I_ds_KPiUzObK"
			},
			"title": "Makeresults Search - With Data Values",
			"options": {
				"chart.showDataLabels": "all"
			}
		},
		"viz_cPjePsq8": {
			"type": "viz.column",
			"dataSources": {
				"primary": "ds_as9vjIDn_ds_KPiUzObK"
			},
			"title": "index=_internal Search - Same Format With Data Values",
			"options": {
				"chart.showDataLabels": "all"
			}
		},
		"viz_Dy5wUhxY": {
			"type": "viz.column",
			"dataSources": {
				"primary": "ds_zNy2Pako_ds_IsoS7KHW"
			},
			"title": "DS.Test",
			"options": {
				"chart.showDataLabels": "all"
			}
		}
	},
	"dataSources": {
		"ds_IsoS7KHW": {
			"name": "fruits",
			"options": {
				"data": {
					"columns": [
						[
							"Apple",
							"Orange",
							"Cherry"
						],
						[
							9,
							37,
							27
						]
					],
					"fields": [
						{
							"name": "Fruit"
						},
						{
							"name": "Value"
						}
					]
				},
				"meta": {}
			},
			"type": "ds.test"
		},
		"ds_V11rXmix_ds_IsoS7KHW": {
			"name": "Copy of fruits",
			"options": {
				"data": {
					"columns": [
						[
							"Apple",
							"Orange",
							"Cherry"
						],
						[
							9,
							37,
							27
						]
					],
					"fields": [
						{
							"name": "Fruit"
						},
						{
							"name": "Value"
						}
					]
				},
				"meta": {}
			},
			"type": "ds.test"
		},
		"ds_KPiUzObK": {
			"type": "ds.search",
			"options": {
				"queryParameters": {
					"earliest": "-24h@h",
					"latest": "now"
				},
				"query": "index=_internal \n|  stats count by sourcetype"
			},
			"name": "Search_1"
		},
		"ds_c5ml9k3I_ds_KPiUzObK": {
			"type": "ds.search",
			"options": {
				"queryParameters": {
					"earliest": "-24h@h",
					"latest": "now"
				},
				"query": "\n|  makeresults \n|  eval name=\"Apples\"\n| eval value=9\n|  append \n    [\n|  makeresults \n|  eval name=\"Orange\"\n| eval value=37 ]\n|  append \n      [\n|  makeresults \n|  eval name=\"Cherry\"\n| eval value=27]\n|  fields - _time"
			},
			"name": "MakeResults"
		},
		"ds_aEbiKLuP_ds_c5ml9k3I_ds_KPiUzObK": {
			"type": "ds.search",
			"options": {
				"queryParameters": {
					"earliest": "-24h@h",
					"latest": "now"
				},
				"query": "\n|  makeresults \n|  eval name=\"Apples\"\n| eval value=9\n|  append \n    [\n|  makeresults \n|  eval name=\"Orange\"\n| eval value=37 ]\n|  append \n      [\n|  makeresults \n|  eval name=\"Cherry\"\n| eval value=27]\n|  fields - _time"
			},
			"name": "Copy of MakeResults"
		},
		"ds_as9vjIDn_ds_KPiUzObK": {
			"type": "ds.search",
			"options": {
				"queryParameters": {
					"earliest": "-24h@h",
					"latest": "now"
				},
				"query": "index=_internal \n|  stats count by sourcetype"
			},
			"name": "Copy of Search_1"
		},
		"ds_zNy2Pako_ds_IsoS7KHW": {
			"name": "Copy of fruits",
			"options": {
				"data": {
					"columns": [
						[
							"Apple",
							"Orange",
							"Cherry"
						],
						[
							9,
							37,
							27
						]
					],
					"fields": [
						{
							"name": "Fruit"
						},
						{
							"name": "Value"
						}
					]
				},
				"meta": {}
			},
			"type": "ds.test"
		}
	},
	"inputs": {},
	"layout": {
		"type": "absolute",
		"options": {
			"display": "auto-scale"
		},
		"structure": [
			{
				"item": "viz_JWN1sI3B",
				"type": "block",
				"position": {
					"x": 0,
					"y": 20,
					"w": 580,
					"h": 280
				}
			},
			{
				"item": "viz_9ILmkyxt",
				"type": "block",
				"position": {
					"x": 0,
					"y": 590,
					"w": 580,
					"h": 260
				}
			},
			{
				"item": "viz_vEOxS1st",
				"type": "block",
				"position": {
					"x": 0,
					"y": 310,
					"w": 580,
					"h": 270
				}
			},
			{
				"item": "viz_2F9srtYn",
				"type": "block",
				"position": {
					"x": 610,
					"y": 310,
					"w": 580,
					"h": 270
				}
			},
			{
				"item": "viz_cPjePsq8",
				"type": "block",
				"position": {
					"x": 610,
					"y": 590,
					"w": 580,
					"h": 260
				}
			},
			{
				"item": "viz_Dy5wUhxY",
				"type": "block",
				"position": {
					"x": 610,
					"y": 20,
					"w": 580,
					"h": 280
				}
			}
		],
		"globalInputs": []
	},
	"description": "",
	"title": "Fruits"
}
- Mark as New
- Bookmark Message
- Subscribe to Message
- Mute Message
- Subscribe to RSS Feed
- Permalink
- Report Inappropriate Content
Thank you for the help. I was able to find a solution that worked for me.
- Previously the data was all under one event in the list of "Results".
- I broke up the data so each Fruit section was it's own event.
- Then used the query " | stats values("amount") by Fruit" to get the bar chart.
{
"Fruit": "Apple",
"amount": 9
},
{
"Fruit": "Orange",
"amount": 37
},
{
"Model": "Cherry",
"Amount": 27
}


Join the Splunk Community Slack to learn, troubleshoot, and make connections with fellow Splunk practitioners in real time!
Join Splunk User Groups to connect and learn in-person by region or remotely by topic or industry.
Supercharging Windows Security Detection Performance: Introducing Hybrid Field ...
Ditch the Manual Grind: Building AI Agents with Splunk
Cisco Data Fabric from Architecture to Investigation, Better SOC Visibility, and More ...
