Turn on suggestions
Auto-suggest helps you quickly narrow down your search results by suggesting possible matches as you type.
Dashboards & Visualizations
×
Join the Conversation
Without signing in, you're just watching from the sidelines. Sign in or Register to connect, share, and be part of the Splunk Community.
Turn on suggestions
Auto-suggest helps you quickly narrow down your search results by suggesting possible matches as you type.
- Find Answers
- :
- Using Splunk
- :
- Dashboards & Visualizations
- :
- 3D column chart custom visualization
Options
- Subscribe to RSS Feed
- Mark Topic as New
- Mark Topic as Read
- Float this Topic for Current User
- Bookmark Topic
- Subscribe to Topic
- Mute Topic
- Printer Friendly Page
- Mark as New
- Bookmark Message
- Subscribe to Message
- Mute Message
- Subscribe to RSS Feed
- Permalink
- Report Inappropriate Content
3D column chart custom visualization
forestfern
New Member
04-23-2021
03:57 AM
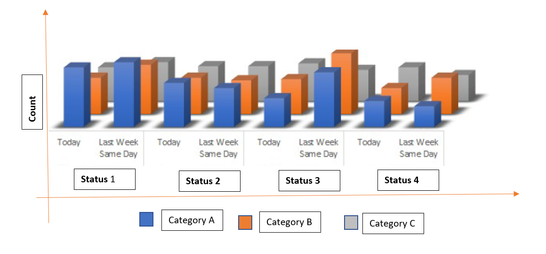
There is a requirement to create a chart that looks like below. Is there an app that can create columns like these? Is anyone aware how to generate 3D columns in Splunk?
Not familiar with JS here, hence finding it difficult to create a custom visualization for this. Appreciate any help on the issue. Thanks!
Get Updates on the Splunk Community!
Application management with Targeted Application Install for Victoria Experience
Experience a new era of flexibility in managing your Splunk Cloud Platform apps! With Targeted Application ...
Index This | What goes up and never comes down?
January 2026 Edition
Hayyy Splunk Education Enthusiasts and the Eternally Curious!
We’re back with this ...
Splunkers, Pack Your Bags: Why Cisco Live EMEA is Your Next Big Destination
The Power of Two: Splunk + Cisco at "Ludicrous Scale"
You know Splunk. You know Cisco. But have you seen ...

