Join the Conversation
- News & Events
- :
- Blog & Announcements
- :
- Community Blog
- :
- Tech Talk | One Log to Rule Them All
Tech Talk | One Log to Rule Them All
- Subscribe to RSS Feed
- Mark as New
- Mark as Read
- Bookmark Topic
- Subscribe
- Printer Friendly Page
- Report Inappropriate Content
One log to rule them all: how you can centralize your troubleshooting with Splunk logs
We know how important logs are when it comes to troubleshooting and monitoring your tech stack. If you’re a Splunk platform customer, you’re already aware of the powerful logging capabilities that Splunk Cloud and Splunk enterprise provide. But did you know that you could also enjoy a no-code interface that combines logs, metrics and traces for faster troubleshooting of your application and infrastructure? That’s what Splunk Observability Cloud is all about!
Splunk Platform and Splunk Observability Cloud
Today, as ITOps and engineering teams, you need to proactively know how things are going, when to pay attention, what the dependencies are and how things are correlated across hybrid & multi-cloud environments. That’s where observability comes in, a practice used by software developers, platform engineers, site reliability engineers and ITOps practitioners to enhance business resilience and solve real business problems. With Splunk Observability, teams can overcome fragmented visibility, alert storms and incident guesswork to fix problems faster, improve reliability and build exceptional customer experiences.
As Splunk users, you don’t need another logging tool to be able to enjoy the benefits of observability. Our Splunk Cloud/Enterprise and Splunk Observability Cloud solutions share the same logs, so you only need to ingest them once to use them across products, teams and use cases.
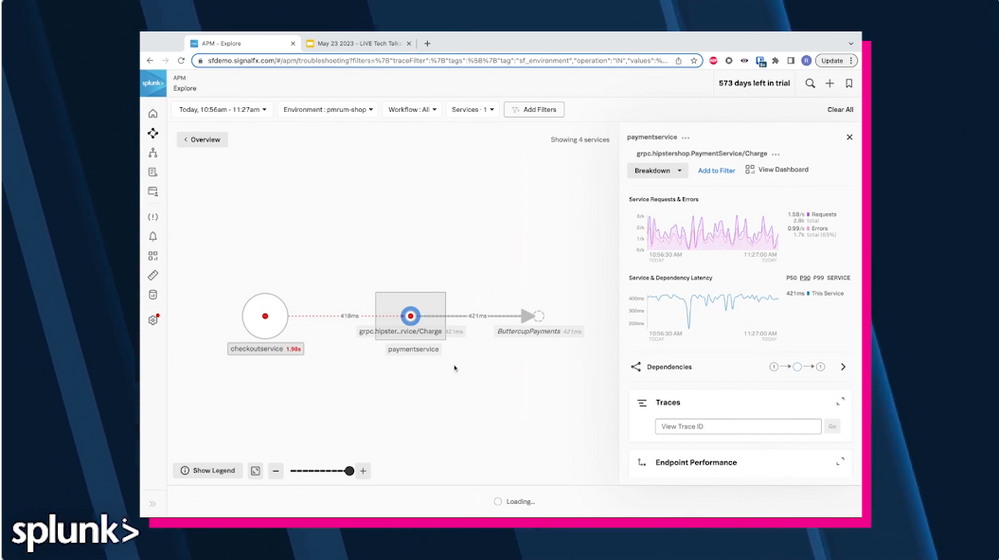
Want to learn more ? Watch the Tech Talk | Play
Logs in Splunk Observability Cloud
You can easily query your logs from the Splunk platform via Log Observer Connect, and use them in Splunk Observability Cloud’s Log Observer, our no-code experience for searching, querying and analyzing logs data. Log Observer offers a unique interface drill down experience compared to Splunk Cloud. With it, you can access log data in the context of metrics and traces with Splunk APM and Splunk Infrastructure Monitoring, granting you a full overview of your data.
Logs Timeline and Log Views are additional logging capabilities available in Splunk Observability Cloud that can help you make the most of your Splunk log investment and optimize your processes. Both of them allow you to combine your logs in a time-based chart with Splunk Infrastructure Monitoring’s real-time metrics in one single dashboard. Logs in dashboards’ trend display allows us to quickly spot any unusual activity in the data. The controls at the top allow us to change the time range and select the index to query. We can then add filters to find and identify related logs and perform quick root cause analysis.
That way, next time you are troubleshooting and need to document your investigation or run log-based analysis to detect patterns or trends, you can just use logs views or logs timeline and add them to your customized dashboards.
Want to learn more ? Watch the Tech Talk!
One Log To Rule Them All: Centralized Troubleshooting With Splunk Logs | Play
View Questions Asked During Live Q&A
You must be a registered user to add a comment. If you've already registered, sign in. Otherwise, register and sign in.
The OpenTelemetry Certified Associate (OTCA) Exam
From Manual to Agentic: Level Up Your SOC at Cisco Live
Splunk Classroom Chronicles: Training Tales and Testimonials (Episode 4)
-
.conf25
31 -
AI
1 -
App Dev
28 -
Career Report
9 -
Cisco Live
5 -
Cloud Platform
37 -
Community
58 -
Community Spotlight
22 -
Developer Spotlight
8 -
Enterprise
40 -
MVP
5 -
Observability
101 -
Office Hours
26 -
OpenTelemetry
49 -
Product Announcements
13 -
Security
52 -
Splunk Lantern
60 -
Splunk Love
7 -
SplunkTrust
31 -
Tech Talks
12 -
User Groups
7


