Join the Conversation
- Find Answers
- :
- Apps & Add-ons
- :
- All Apps and Add-ons
- :
- Re: Why search with postprocessing returns no resu...
- Subscribe to RSS Feed
- Mark Topic as New
- Mark Topic as Read
- Float this Topic for Current User
- Bookmark Topic
- Subscribe to Topic
- Mute Topic
- Printer Friendly Page
- Mark as New
- Bookmark Message
- Subscribe to Message
- Mute Message
- Subscribe to RSS Feed
- Permalink
- Report Inappropriate Content
Why search with postprocessing returns no results in dashboard, but the actual search does?
Heya,
I've looked around Answers for a similar problem, but haven't found one yet (edit: I know it seems to be a common problem, but let's say I haven't found a scenario like mine, or an answer). I'm sure this is something really simple that I've done wrong, and it's nagging at me.
I have a simple search that I've plugged into the postprocessing example from the Splunk 6.x Dashboards templates. Here's an excerpt:
  <label>CIP Application Metrics</label>
  <description>Each panel post processes the base search through a separate search pipeline.</description>
  <searchTemplate>index=main eventtype=cip-prd layer7_app="CIP"</searchTemplate>

<snip fieldset/timepicker stuff/>

  <row>
    <panel>
      <chart>
        <title>Inbound Connections</title>
        <searchPostProcess>timechart span=1m sum(cip_inbound_connections_http) by host | fillnull value=0</searchPostProcess>
        <option name="charting.chart">line</option>
        <option name="charting.axisLabelsX.majorLabelStyle.overflowMode">ellipsisNone</option>
        <option name="charting.axisLabelsX.majorLabelStyle.rotation">0</option>
        <option name="charting.axisTitleX.visibility">visible</option>
        <option name="charting.axisTitleY.visibility">visible</option>
        <option name="charting.axisTitleY2.visibility">visible</option>
        <option name="charting.axisX.scale">linear</option>
        <option name="charting.axisY.scale">logarithmic</option>
        <option name="charting.axisY2.enabled">false</option>
        <option name="charting.axisY2.scale">inherit</option>
        <option name="charting.chart.nullValueMode">gaps</option>
        <option name="charting.chart.sliceCollapsingThreshold">0.01</option>
        <option name="charting.chart.stackMode">default</option>
        <option name="charting.chart.style">shiny</option>
        <option name="charting.drilldown">all</option>
        <option name="charting.layout.splitSeries">0</option>
        <option name="charting.legend.labelStyle.overflowMode">ellipsisMiddle</option>
        <option name="charting.legend.placement">right</option>
        <option name="wrap">true</option>
        <option name="rowNumbers">false</option>
        <option name="dataOverlayMode">none</option>
      </chart>
    </panel>
When the dashboards run, it returns "no results" in all of the panels I've created with their specific search criteria and timecharts. I can't upload a screenshot, because I have insufficient karma (doh).
But when I "open the search" in a new window from that dashboard panel, the search performs as expected. I have three timechart lines showing the connections by host over the specified period.
This isn't a huge result set - maybe a total of 180 records per hour. There shouldn't be gaps, because each field should return a "0" rather than a null, but I added a fillnull to be extra sure.
Is there something really embarrassing that I'm missing, here? I'm using Splunk 6.1.2, and the 6.1 template. I'm not using SideView, unless that's somehow bundled into the dashboard templates. I'd be grateful for a nudge in the right direction.
- Mark as New
- Bookmark Message
- Subscribe to Message
- Mute Message
- Subscribe to RSS Feed
- Permalink
- Report Inappropriate Content
I just ran into a similar issue with post-processing using a summary index. The summary index uses | fields rather than | table. In my base search prior to post-processing, I added | table *, and that helped to force the fields down for post-processing. Thanks for the tips!
- Mark as New
- Bookmark Message
- Subscribe to Message
- Mute Message
- Subscribe to RSS Feed
- Permalink
- Report Inappropriate Content
Keep an eye out that I think some of the tags used in this post are deprecated. I think this is the same as what is now done with base and id attributes on the search object. The tags are described a bit here: http://docs.splunk.com/Documentation/Splunk/latest/Viz/PanelreferenceforSimplifiedXML#search
Not sure if the newer tags express the same issue discussed here.
- Mark as New
- Bookmark Message
- Subscribe to Message
- Mute Message
- Subscribe to RSS Feed
- Permalink
- Report Inappropriate Content
- Mark as New
- Bookmark Message
- Subscribe to Message
- Mute Message
- Subscribe to RSS Feed
- Permalink
- Report Inappropriate Content
Just spoke with my product manager over the SimpleXML…
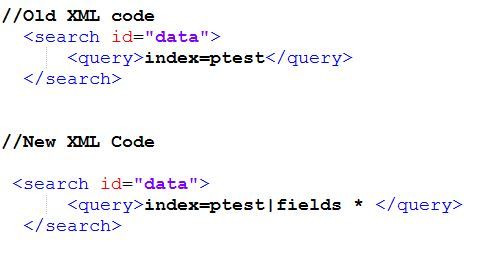
Change your searchTemplate to this:
<searchTemplate>index=main eventtype=cip-prd layer7_app=“CIP | fields *"</searchTemplate>
It's because we run all dashboard searches in fast mode, so fields are not passed down to the post process search. Adding the " *| fields **" will force the search to extract all fields and make them available for the post process. Thanks Nick!

