Join the Conversation
- Find Answers
- :
- Apps & Add-ons
- :
- All Apps and Add-ons
- :
- Splunk JMX addon
- Subscribe to RSS Feed
- Mark Topic as New
- Mark Topic as Read
- Float this Topic for Current User
- Bookmark Topic
- Subscribe to Topic
- Mute Topic
- Printer Friendly Page
- Mark as New
- Bookmark Message
- Subscribe to Message
- Mute Message
- Subscribe to RSS Feed
- Permalink
- Report Inappropriate Content
Splunk JMX addon
Hi,
I have downloaded Splunk_JMX addon , I have untar the package from backend and restarted my server,
If I go to JMX addon from front end, I see the page loading for long time, I don't see anything coming up.
I see the problem in version 5.0.1. I don't see any problem with 5.0.0.
Is there any configuration to be done other than untaring it?
- Mark as New
- Bookmark Message
- Subscribe to Message
- Mute Message
- Subscribe to RSS Feed
- Permalink
- Report Inappropriate Content
It's working in my local instance.
Check Splunk version .
Check JMX version .
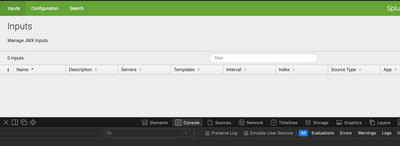
Can you please do inspect element by right clicking on browser then reload page and select input.
You will see below section in your browser. Can you please check any error is there? You can check network tab also with 500 or 50* error.
If you see any error, can you please share that error?
Meanwhile you can share your Splunk version also.
Thanks
KV
▄︻̷̿┻̿═━一
If any of my reply helps you to solve the problem Or gain knowledge, an upvote would be appreciated.
- Mark as New
- Bookmark Message
- Subscribe to Message
- Mute Message
- Subscribe to RSS Feed
- Permalink
- Report Inappropriate Content


