- Mark as New
- Bookmark Message
- Subscribe to Message
- Mute Message
- Subscribe to RSS Feed
- Permalink
- Report Inappropriate Content
Hi Guys,
ive installed the Splunk App for *nix on my S.H, but all dashboards within the app are coming up "no results found".
Ive followed the install doco [ https://docs.splunk.com/Documentation/UnixApp/5.2.5/User/DeploytheSplunkAppforUnixandLinuxinadistrib... ] to the letter... in my case:
1/ on the S.H/ & INDEXER (combined in my case): installed the APP and the TA add-on
2/ on the linux host i want to monitor: installed the UF and the TA add-on and configured the inputs.conf to start gathering as per snapshot here:
keiran@vm-untrust:/opt/splunkforwarder/etc/apps/Splunk_TA_nix/local$ cat inputs.conf
# Copyright (C) 2019 Splunk Inc. All Rights Reserved.
[script://./bin/vmstat.sh]
interval = 60
sourcetype = vmstat
source = vmstat
disabled = 0

[script://./bin/iostat.sh]
interval = 60
sourcetype = iostat
source = iostat
disabled = 0

[script://./bin/nfsiostat.sh]
interval = 60
sourcetype = nfsiostat
source = nfsiostat
disabled = 0

[script://./bin/ps.sh]
interval = 30
sourcetype = ps
source = ps
disabled = 0

[script://./bin/top.sh]
interval = 60
sourcetype = top
source = top
disabled = 0

[script://./bin/netstat.sh]
interval = 60
sourcetype = netstat
source = netstat
disabled = 0
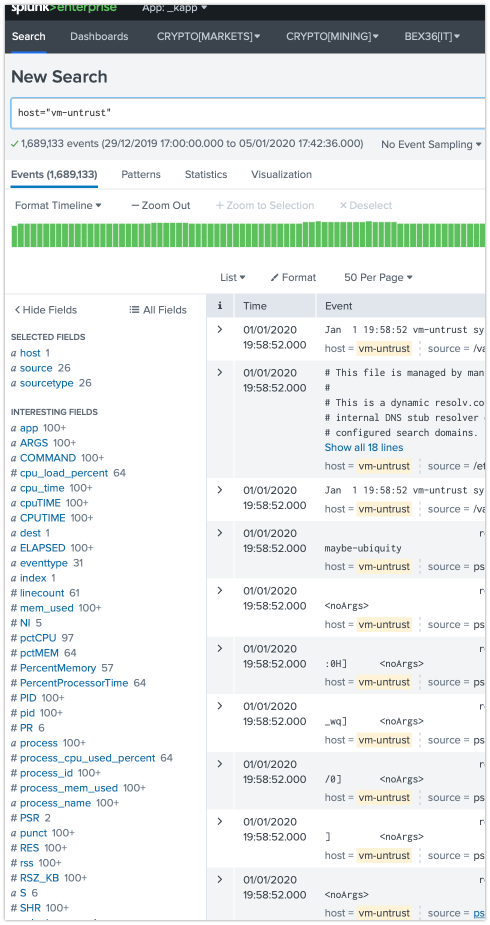
I have confirmed data is coming in at the indexer / search head from the linux box i want to monitor, and the 'interesting fields' seem to be pulling an awful lot of data back.... so why arent the dashboards working?:
not quite sure where to start t/shooting this, so any help most appreciated!!
thanks team!
K.
- Mark as New
- Bookmark Message
- Subscribe to Message
- Mute Message
- Subscribe to RSS Feed
- Permalink
- Report Inappropriate Content
Recently had the same issue. In my case the forwarders were sending results to the main index instead of os index. I had to add index = os to ALL the inputs in inputs.conf deployed on the UF:
apps/Splunk_TA_nix/local/inputs.conf
################################################
############### Event Inputs ###################
################################################
[script://./bin/vmstat.sh]
interval = 60
disabled = false
index = os
[script://./bin/iostat.sh]
interval = 60
disabled = false
index = os
[script://./bin/nfsiostat.sh]
interval = 60
disabled = false
index = os
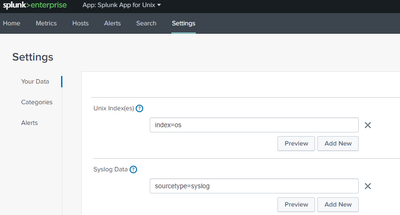
Then verified the index in Settings/Your Data.
You'll need to have an account with admin to "save" changes.
I restarted my search head and forwarders after the changes to verify. If using a deployment server, make the UF changes in the Splunk_TA_nix deployment app.
Splunk 7.5.2
UF 7.3.1+
Splunk_TA_nix 8.1.0
Splunk App for Unix 6.0.0
- Mark as New
- Bookmark Message
- Subscribe to Message
- Mute Message
- Subscribe to RSS Feed
- Permalink
- Report Inappropriate Content
For anyone else running into this... you don't need to change indexes on all inputs for all forwards. You can keep working with what you already have. All of these dashboards are fed via macros, which reference other macros. Ultimately, they all reference the os_index macro, which is literally just a "index = os" definition. Change that, via the web config or in .../etc/apps/splunk_app_for_nix/local/macros.conf then reboot Splunk and you're set.
- Mark as New
- Bookmark Message
- Subscribe to Message
- Mute Message
- Subscribe to RSS Feed
- Permalink
- Report Inappropriate Content
Thanks @furl for looping back with this!
Last week i actually started the move over to IT Essentials Work app after Splunk sunset’d Splunk App for *nix
- Mark as New
- Bookmark Message
- Subscribe to Message
- Mute Message
- Subscribe to RSS Feed
- Permalink
- Report Inappropriate Content
thanks @taldavita - that was *exactly* the issue (sorry for the delayed reply - I missed the notifications on this thread somehow). Thanks so much ! Enjoying my new dashboards now ...
- Mark as New
- Bookmark Message
- Subscribe to Message
- Mute Message
- Subscribe to RSS Feed
- Permalink
- Report Inappropriate Content
I haven't used the app but in your screen shots, I don't see which index the dashboard is looking to get its data. You may want to check to make sure they match. Also check the dashboard time picker vs. the data.


