
Join the Conversation
- Find Answers
- :
- Apps & Add-ons
- :
- All Apps and Add-ons
- :
- All Apps and Add-ons
- :
- Re: Search and identify connectivity errors in RES...
- Subscribe to RSS Feed
- Mark Topic as New
- Mark Topic as Read
- Float this Topic for Current User
- Bookmark Topic
- Subscribe to Topic
- Mute Topic
- Printer Friendly Page
- Mark as New
- Bookmark Message
- Subscribe to Message
- Mute Message
- Subscribe to RSS Feed
- Permalink
- Report Inappropriate Content
Search and identify connectivity errors in REST Modular Input

Hi,
I am using the REST API Modular Input app to query a RabbitMQ management API. If the service goes down, I get connectivity errors (as expected). But I can't see how to report back these errors to the Splunk index from the REST App. I can see errors in the splunkd.log stating;
05-13-2015 11:57:04.305 +1000 ERROR ExecProcessor - message from "python "C:\Program Files\Splunk\etc\apps\rest_ta\bin\rest.py"" Exception performing request: HTTPConnectionPool(host='localhost', port=15672): Max retries exceeded with url: /api/vhosts (Caused by <class 'socket.error'>: [Errno 10061] No connection could be made because the target machine actively refused it)
But I can't see these events in the Splunk serach. It would be great to combine succesful JSON data with another widget to monitor connectivity errors. Is this something I can do with this app, or do I need to indexc a new data source for this connection/service?
- Mark as New
- Bookmark Message
- Subscribe to Message
- Mute Message
- Subscribe to RSS Feed
- Permalink
- Report Inappropriate Content

Any runtime errors (ie : messages that get written to splunkd.log) , are easily searchable in Splunk :
index=_internal ExecProcessor error rest.py
- Mark as New
- Bookmark Message
- Subscribe to Message
- Mute Message
- Subscribe to RSS Feed
- Permalink
- Report Inappropriate Content


- Mark as New
- Bookmark Message
- Subscribe to Message
- Mute Message
- Subscribe to RSS Feed
- Permalink
- Report Inappropriate Content
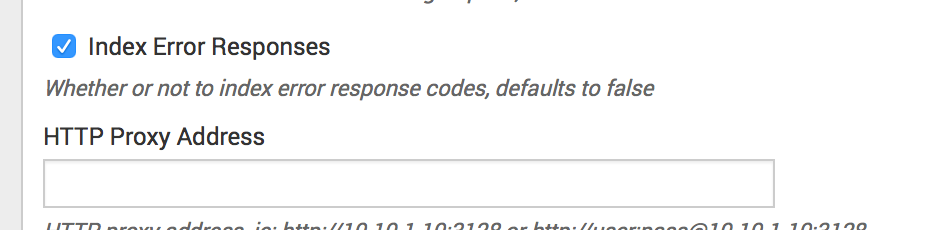
Yeah I've got that turned on but it doesn't seem to do anything in this case. Perhaps that handles explicit HTTP errors, but what if the service is completely down? In this case, I don't get HTTP error, I get connectivity faults, as noted in the log above.

Join the Splunk Community Slack to learn, troubleshoot, and make connections with fellow Splunk practitioners in real time!
Join Splunk User Groups to connect and learn in-person by region or remotely by topic or industry.
Accelerate Splunk App Development with AI
Splunk Agent Observability: Measuring AI Value with Splunk Tokenomics on AWS
Enterprise Security Watch Party: What’s New in 8.8 - Recap
