Join the Conversation
- Find Answers
- :
- Apps & Add-ons
- :
- All Apps and Add-ons
- :
- All Apps and Add-ons
- :
- Re: Monitoring Azure Storage Blobs - for performan...
- Subscribe to RSS Feed
- Mark Topic as New
- Mark Topic as Read
- Float this Topic for Current User
- Bookmark Topic
- Subscribe to Topic
- Mute Topic
- Printer Friendly Page
- Mark as New
- Bookmark Message
- Subscribe to Message
- Mute Message
- Subscribe to RSS Feed
- Permalink
- Report Inappropriate Content
Monitoring Azure Storage Blobs - for performance parameters
I am trying to monitor the Azure Storage Blobs and when we try logging into the application “Splunk Template for Microsoft Azure”, the dashboards for Storage (Usage-->Storage Accounts) displays the following error:
Does anybody know what we are doing wrong? Or alternately, if you have some specific documentation on permissions to check or API calls to run to see if data is being fetched would be helpful.
The exact error is: macro 'azure-metrics-storage' that cannot be found. Reasons include: the macro name is misspelled, you do not have "read" permission for the macro, or the macro has not been shared with this application. Click Settings, Advanced
This macro didn’t exist at all. We tried creating the macro manually (to point to the index where storage data was written to and the mscs:storgage* sourcetype) and the dashboards just show null values.
For configuring the Storage Accounts, we followed the instructions as defined in the Microsoft Cloud Services Add-On. These are showing up properly in the Azure Storage Account configuration page.
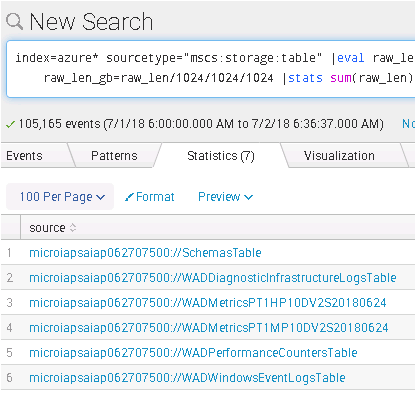
For sourcetype mscs:storage:table we are seeing data only for below sources. Which seems to be missing any of the performance parameters as described in the dashboard. We have configured the Azure account with full permissions. So it should be returning all data.
Also, we saw this one error in the log files that was quite old but thought of sharing.
2018-07-02 04:39:01,574 +0000 log_level=ERROR, pid=60847, tid=Thread-14300, file=mscs_storage_table_data_collector.py, func_name=collect_data, code_line_no=62 | [stanza_name="ICP-AzureVMmetrics" account_name="microiapsaiap062707500" table_name="WADMetricsPT1MP10DV2S20180425"] Error occurred in collecting data Traceback (most recent call last): File "/opt/splunk/etc/apps/Splunk_TA_microsoft-cloudservices/bin/splunktamscs/mscs_storage_table_data_collector.py", line 58, in collect_data self._do_collect_data() File "/opt/splunk/etc/apps/Splunk_TA_microsoft-cloudservices/bin/splunktamscs/mscs_storage_table_data_collector.py", line 107, in _do_collect_data marker=page_link File "/opt/splunk/etc/apps/Splunk_TA_microsoft-cloudservices/bin/splunktamscs/azure/storage/table/tableservice.py", line 685, in query_entities resp = self._query_entities(*args, **kwargs) File "/opt/splunk/etc/apps/Splunk_TA_microsoft-cloudservices/bin/splunktamscs/azure/storage/table/tableservice.py", line 749, in _query
- Mark as New
- Bookmark Message
- Subscribe to Message
- Mute Message
- Subscribe to RSS Feed
- Permalink
- Report Inappropriate Content
There was an update to the app on June 14, 2018 to address the macro issue. The "Storage Metrics" dashboard is populated by Azure Metrics data collected by the Azure Monitor Add-on for Splunk. Configure your Azure Storage Account(s) with a tag named Metrics and a value of *. See this blog post for more details about setting up the Azure Monitor Add-on.
- Mark as New
- Bookmark Message
- Subscribe to Message
- Mute Message
- Subscribe to RSS Feed
- Permalink
- Report Inappropriate Content
@sloshBurch - I am working with @snayak on the same issue. We configured the storage account as mentioned in the blog and not getting any events from Azure Monitor Add on. Seeing the below error in the log files
2018-07-13 10:56:56,606 +0000 log_level=ERROR, pid=38173, tid=Thread-580, file=mscs_storage_table_data_collector.py, func_name=collect_data, code_line_no=62 | [stanza_name="ICP-AzureVMmetrics" account_name="microiapsaiap062707500" table_name="WADMetricsPT1MP10DV2S20180224"] Error occurred in collecting data Traceback (most recent call last): File "/opt/splunk/etc/apps/Splunk_TA_microsoft-cloudservices/bin/splunktamscs/mscs_storage_table_data_collector.py", line 58, in collect_data self._do_collect_data() File "/opt/splunk/etc/apps/Splunk_TA_microsoft-cloudservices/bin/splunktamscs/mscs_storage_table_data_collector.py", line 107, in _do_collect_data marker=page_link File "/opt/splunk/etc/apps/Splunk_TA_microsoft-cloudservices/bin/splunktamscs/azure/storage/table/tableservice.py", line 685, in query_entities resp = self._query_entities(*args, **kwargs) File "/opt/splunk/etc/apps/Splunk_TA_microsoft-cloudservices/bin/splunktamscs/azure/storage/table/tableservice.py", line 749, in _query_entities response = self._perform_request(request) File "/opt/splunk/etc/apps/Splunk_TA_microsoft-cloudservices/bin/splunktamscs/azure/storage/storageclient.py", line 195, in _perform_request _storage_error_handler(HTTPError(response.status, response.message, response.headers, response.body)) File "/opt/splunk/etc/apps/Splunk_TA_microsoft-cloudservices/bin/splunktamscs/azure/storage/_serialization.py", line 125, in _storage_error_handler return _general_error_handler(http_error) File "/opt/splunk/etc/apps/Splunk_TA_microsoft-cloudservices/bin/splunktamscs/azure/storage/_error.py", line 74, in _general_error_handler raise AzureHttpError(message, http_error.status) AzureHttpError: Internal Server Error {"odata.error":{"code":"OperationTimedOut","message":{"lang":"en-US","value":"Operation could not be completed within the specified time.\nRequestId:7d74a9d4-5002-0025-0298-1a399e000000\nTime:2018-07-13T10:57:28.0268622Z"}}},
- Mark as New
- Bookmark Message
- Subscribe to Message
- Mute Message
- Subscribe to RSS Feed
- Permalink
- Report Inappropriate Content
The error message you posted is from the Splunk Add-on for Microsoft Cloud Services. The "Storage Accounts" dashboard in the Azure template app expects data from the Azure Monitor Add-on for Splunk. Check out these blog posts on how to install and configure the Azure Monitor Add-on for Splunk:
- Mark as New
- Bookmark Message
- Subscribe to Message
- Mute Message
- Subscribe to RSS Feed
- Permalink
- Report Inappropriate Content
@snayak - Did this resolve the question? The answer was not marked as 'accepted' hence the follow up.
- Mark as New
- Bookmark Message
- Subscribe to Message
- Mute Message
- Subscribe to RSS Feed
- Permalink
- Report Inappropriate Content
I cleaned up your post a bit cause the message had the same text twice. Hopefully I made it easier to read and didn't remove important items.
- Mark as New
- Bookmark Message
- Subscribe to Message
- Mute Message
- Subscribe to RSS Feed
- Permalink
- Report Inappropriate Content
@snayak - Did that work to resolve? Make sure to accept the answer if so.


