Are you a member of the Splunk Community?
- Find Answers
- :
- Apps & Add-ons
- :
- All Apps and Add-ons
- :
- MQ Series App for Splunk
- Subscribe to RSS Feed
- Mark Topic as New
- Mark Topic as Read
- Float this Topic for Current User
- Bookmark Topic
- Subscribe to Topic
- Mute Topic
- Printer Friendly Page
- Mark as New
- Bookmark Message
- Subscribe to Message
- Mute Message
- Subscribe to RSS Feed
- Permalink
- Report Inappropriate Content
MQ Series App for Splunk
Some of the components that can be monitored in WebSphere MQ are:
Channel ( Status, Bytes- Sent, Received, Buffers- Sent, Received)
Listener Stats (Status, Session Count, Backlog, Health)
Queue (Current Depth, % of Queue Occupied, Open Input Count, Open Output Count, Health, Drain Rate).
Has anyone created an app that can the monitoring listed above for MQ?
- Mark as New
- Bookmark Message
- Subscribe to Message
- Mute Message
- Subscribe to RSS Feed
- Permalink
- Report Inappropriate Content
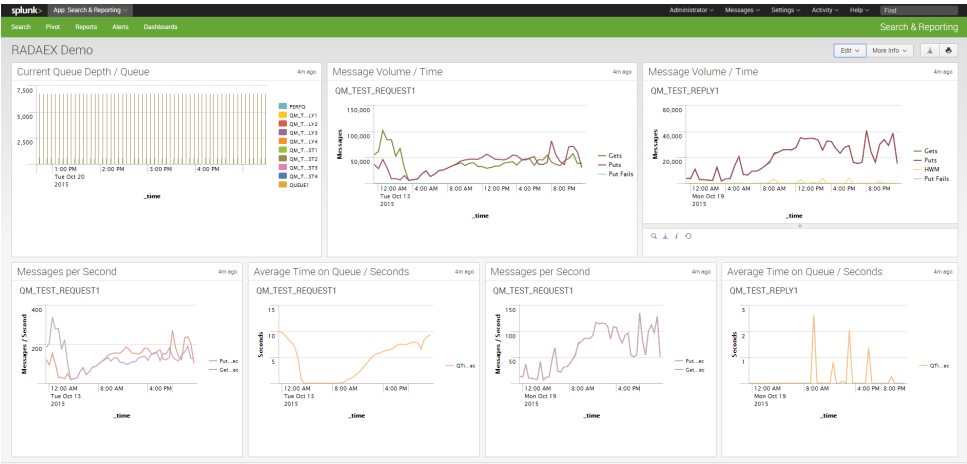
It's possible monitor IBM MQ by feeding all the IBM MQ Status, Statistics, Events and usage data into SPLUNK using a tool called Lamaxu, www.queuemetrix.com/2015/12/21/how-to-integrate-lamaxu-with-splunk/
Lamaxu supports queue managers deployed to all platforms, including AIX, Linux, iSeries, Windows and ZOS etc, as well as MQ message volume statistics and dataset usage from Mainframe ZOS managers.
- Mark as New
- Bookmark Message
- Subscribe to Message
- Mute Message
- Subscribe to RSS Feed
- Permalink
- Report Inappropriate Content


