
Join the Conversation
- Find Answers
- :
- Apps & Add-ons
- :
- All Apps and Add-ons
- :
- All Apps and Add-ons
- :
- How to search and aggregate user behavior data in ...
- Subscribe to RSS Feed
- Mark Topic as New
- Mark Topic as Read
- Float this Topic for Current User
- Bookmark Topic
- Subscribe to Topic
- Mute Topic
- Printer Friendly Page
- Mark as New
- Bookmark Message
- Subscribe to Message
- Mute Message
- Subscribe to RSS Feed
- Permalink
- Report Inappropriate Content

I have user behavior data like below in splunk, and I want to create a query which can aggregate the user behavior data in a httpsessionID , and then visualize the data by Sankey chart for understanding the user flow.
timestamp, sessionID, Customer, UserID, module, page, behavior
12:00:00, SID1, CustomerA, UserA, moduleA, pageA, Open PageA
12: 00:01, SID1, CustomerA, UserA, moduleA, pageA, Search
12:00:02, SID1, CustomerA, UserA, moduleA, pageA, Search
12:00:01, SID2, CustomerB, UserB, moduleA, pageA, Open PageA
12:00:02, SID2, CustomerB, UserB, moduleA, pageA, Serach
12:00:03, SID2, CustomerB, UserB, moduleA, pageA, Search
12:00:01, SID3, CustomerC, UserC, moduleA, pageC, Open PageC
12:00:02, SID3, CustomerC, UserC, moduleA, pageC, Generate Report
12:00:03, SID3, CustomerC, UserC, moduleA, pageC, Update Report
From above data, I want to create a Sankey chart like below, Please advise how to write the query. Thank you!



- Mark as New
- Bookmark Message
- Subscribe to Message
- Mute Message
- Subscribe to RSS Feed
- Permalink
- Report Inappropriate Content

| makeresults
| eval _raw="timestamp, sessionID, Customer, UserID, module, page, behavior
12:00:00, SID1, CustomerA, UserA, moduleA, pageA, Open PageA
12: 00:01, SID1, CustomerA, UserA, moduleA, pageA, Search
12:00:02, SID1, CustomerA, UserA, moduleA, pageA, Search
12:00:01, SID2, CustomerB, UserB, moduleA, pageA, Open PageA
12:00:02, SID2, CustomerB, UserB, moduleA, pageA, Search
12:00:03, SID2, CustomerB, UserB, moduleA, pageA, Search
12:00:01, SID3, CustomerC, UserC, moduleA, pageC, Open PageC
12:00:02, SID3, CustomerC, UserC, moduleA, pageC, Generate Report
12:00:03, SID3, CustomerC, UserC, moduleA, pageC, Update Report"
| multikv forceheader=1
| table timestamp, sessionID, Customer, UserID, module, page, behavior
| rename COMMENT as "from here, the logic"
| eventstats list(behavior) as list_behavior by sessionID
| eventstats list(page) as list_page by sessionID
| appendpipe
    [| eventstats values(module) as start values(page) as end by UserID]
| appendpipe
    [| eventstats first(eval(mvindex(list_page,0))) as start first(eval(mvindex(list_behavior,0))) as end by UserID]
| appendpipe
    [| eventstats first(eval(mvindex(list_behavior,0))) as start first(eval(mvindex(list_behavior,1))) as end by UserID]
| appendpipe
    [| eventstats first(eval(mvindex(list_behavior,1))) as start first(eval(mvindex(list_behavior,2))) as end by UserID]
| streamstats count
| eval tmp=mvzip(count,mvzip(start,end))
| stats count by tmp
| sort tmp
| eval tmp=replace(tmp,"\d+\,","")
| dedup tmp
| eval start=mvindex(split(tmp,","),0), end=mvindex(split(tmp,","),1)
| eventstats count(end) as count by end
| eval end=if(start==end,end.".",end)
| table start end count
Hi, @cheriemilk
with | eval end=if(start==end,end.".",end) , since the start and end are the same, the indications is consolidated.
You have to count a little more in order to display beautifully like the example.
- Mark as New
- Bookmark Message
- Subscribe to Message
- Mute Message
- Subscribe to RSS Feed
- Permalink
- Report Inappropriate Content
| makeresults
| eval _raw="timestamp, sessionID, Customer, UserID, module, page, behavior
12:00:00, SID1, CustomerA, UserA, moduleA, pageA, Open PageA
12: 00:01, SID1, CustomerA, UserA, moduleA, pageA, Search
12:00:02, SID1, CustomerA, UserA, moduleA, pageA, Search
12:00:01, SID2, CustomerB, UserB, moduleA, pageA, Open PageA
12:00:02, SID2, CustomerB, UserB, moduleA, pageA, Search
12:00:03, SID2, CustomerB, UserB, moduleA, pageA, Search
12:00:01, SID3, CustomerC, UserC, moduleA, pageC, Open PageC
12:00:02, SID3, CustomerC, UserC, moduleA, pageC, Generate Report
12:00:03, SID3, CustomerC, UserC, moduleA, pageC, Update Report"
| multikv forceheader=1
| table timestamp, sessionID, Customer, UserID, module, page, behavior
| rename COMMENT as "from here, the logic"
| eventstats list(behavior) as list_behavior by sessionID
| eventstats list(page) as list_page by sessionID
| appendpipe
    [| eventstats values(module) as start values(page) as end by UserID]
| appendpipe
    [| eventstats first(eval(mvindex(list_page,0))) as start first(eval(mvindex(list_behavior,0))) as end by UserID]
| appendpipe
    [| eventstats first(eval(mvindex(list_behavior,0))) as start first(eval(mvindex(list_behavior,1))) as end by UserID]
| appendpipe
    [| eventstats first(eval(mvindex(list_behavior,1))) as start first(eval(mvindex(list_behavior,2))) as end by UserID]
| streamstats count
| eval tmp=mvzip(count,mvzip(start,end))
| stats count by tmp
| sort tmp
| eval tmp=replace(tmp,"\d+\,","")
| dedup tmp
| eval start=mvindex(split(tmp,","),0), end=mvindex(split(tmp,","),1)
| eventstats count(end) as count by end
| eval end=if(start==end,end.".",end)
| table start end count
Hi, @cheriemilk
with | eval end=if(start==end,end.".",end) , since the start and end are the same, the indications is consolidated.
You have to count a little more in order to display beautifully like the example.
- Mark as New
- Bookmark Message
- Subscribe to Message
- Mute Message
- Subscribe to RSS Feed
- Permalink
- Report Inappropriate Content
Hi, @to4kawa ,
Thank you for the proposal. I add prefix for each step actions to avoid situation that the start and end action could be the same.
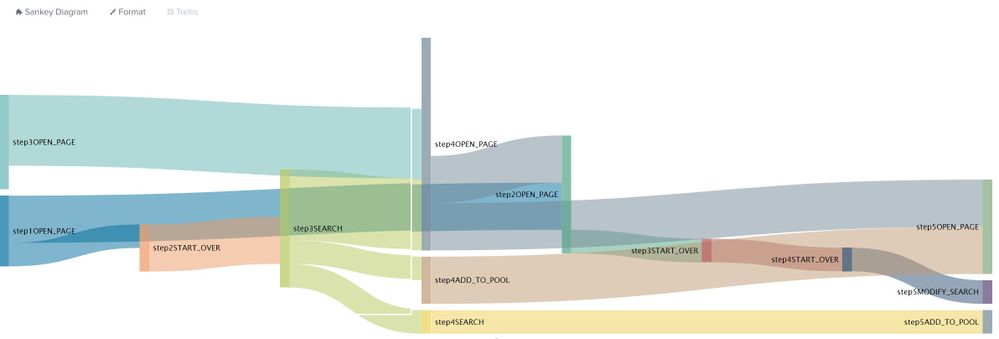
I met another problem now. When I run the query with real data in splunk and append 10 steps in a sessionID. I found the nodes are discorded which make the Sankey chart hard to read, instead of the expected order: step1->step2->step3 etc.. Please refer to my screenshot. Is there any way to avoid this?
- Mark as New
- Bookmark Message
- Subscribe to Message
- Mute Message
- Subscribe to RSS Feed
- Permalink
- Report Inappropriate Content
@to4kawa , Please refer the to attachment "Sankey nodes disordered" in the top of this thread.
- Mark as New
- Bookmark Message
- Subscribe to Message
- Mute Message
- Subscribe to RSS Feed
- Permalink
- Report Inappropriate Content
hi @cheriemilk
Screen confirmed.
The order has been adjusted in various ways this time.
I won't know without actual queries and results.
- Mark as New
- Bookmark Message
- Subscribe to Message
- Mute Message
- Subscribe to RSS Feed
- Permalink
- Report Inappropriate Content
I found that adding prefix for each step like below doesn't fix the data backflow issue actually
. for example below query doesn't create the correct sankey. (I removed the last event for userC)
| makeresults
| eval _raw="timestamp, sessionID, Customer, UserID, module, page, behavior
12:00:00, SID1, CustomerA, UserA, moduleA, pageA, Open PageA
12:00:01, SID1, CustomerA, UserA, moduleA, pageA, Search
12:00:02, SID1, CustomerA, UserA, moduleA, pageA, Search
12:00:01, SID2, CustomerB, UserB, moduleA, pageA, Open PageA
12:00:02, SID2, CustomerB, UserB, moduleA, pageA, Search
12:00:03, SID2, CustomerB, UserB, moduleA, pageA, Search
12:00:01, SID3, CustomerC, UserC, moduleA, pageC, Open PageC
12:00:02, SID3, CustomerC, UserC, moduleA, pageC, Generate Report"
| multikv forceheader=1
| table timestamp, sessionID, Customer, UserID, module, page, behavior
| eventstats list(behavior) as list_behavior by sessionID
| appendpipe
[| eventstats first(eval("step1".mvindex(list_behavior,0))) as start first(eval("step2".mvindex(list_behavior,1))) as end by UserID]
| appendpipe
[| eventstats first(eval("step2".mvindex(list_behavior,1))) as start first(eval("step3".mvindex(list_behavior,2))) as end by UserID]
| appendpipe
[| eventstats first(eval("step3".mvindex(list_behavior,2))) as start first(eval(if(isnull(mvindex(list_behavior,3), "step4".mvindex(list_behavior,3), "exit"))))) as end by UserID]
| streamstats count
| eval tmp=mvzip(count,mvzip(start,end))
| stats count by tmp
| sort tmp
| eval tmp=replace(tmp,"\d+\,","")
| dedup tmp
| eval start=mvindex(split(tmp,","),0), end=mvindex(split(tmp,","),1)
| eventstats count(end) as count by end
| eval end=if(start==end,end.".",end)
| table tmp start end count

Join the Splunk Community Slack to learn, troubleshoot, and make connections with fellow Splunk practitioners in real time!
Join Splunk User Groups to connect and learn in-person by region or remotely by topic or industry.
Agent Mode Engaged! Enchaining Agentic Operations with Splunk AI Assistant 2.0
Announcing Modern Navigation: A New Era of Splunk User Experience
Modernize your Splunk Apps – Introducing Python 3.13 in Splunk
