Join the Conversation
- Find Answers
- :
- Apps & Add-ons
- :
- All Apps and Add-ons
- :
- How to add more resource fields in Timeline plugin...
- Subscribe to RSS Feed
- Mark Topic as New
- Mark Topic as Read
- Float this Topic for Current User
- Bookmark Topic
- Subscribe to Topic
- Mute Topic
- Printer Friendly Page
- Mark as New
- Bookmark Message
- Subscribe to Message
- Mute Message
- Subscribe to RSS Feed
- Permalink
- Report Inappropriate Content
How to add more resource fields in Timeline plugin?
Hello Splunk community,
I'm testing Splunk Timeline - Custom Visualization plugin. I'd like to visualize distributed tracing in my microservices architecture, like app name, request URL, response codes, etc.
According to the documentation , I can specify only one resource field. How can use more fields?
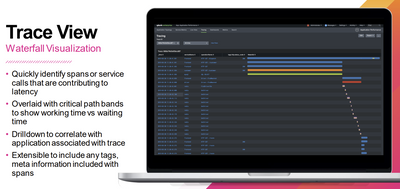
I also found Splunk .conf19 presentation and the 19th slide looks promising:
Unfortunately, mentioned presentation doesn't provide us with implementation details. Could you point me in the right direction to achieve the same, please? Any help would be much appreciated. Thanks!
- Mark as New
- Bookmark Message
- Subscribe to Message
- Mute Message
- Subscribe to RSS Feed
- Permalink
- Report Inappropriate Content
If a visualization says you can use only one field then you cannot use more than one field. You may, however, get it to work by concatenating multiple fields into a single field. The results may not make much sense, however, and the method doesn't work with numeric data.
Looking at the cited presentation, slide 19 uses the term "waterfall visualization". A search in splunkbase for that term returns the app at https://splunkbase.splunk.com/app/3669/. Perhaps that will do what you want.
If this reply helps you, Karma would be appreciated.
- Mark as New
- Bookmark Message
- Subscribe to Message
- Mute Message
- Subscribe to RSS Feed
- Permalink
- Report Inappropriate Content
Thanks. I've already tried concatenation but this plugin seems to be implemented poorly and longer strings get truncated on the tooltip. In addition, I didn't manage to break the line which makes it less readable.
In terms of "waterfall visualization", looks like it's compatible with Splunk Enterprise only and I couldn't find any documentation for that.

