Join the Conversation
- Find Answers
- :
- Apps & Add-ons
- :
- All Apps and Add-ons
- :
- All Apps and Add-ons
- :
- How do I debug Python code running in Splunk Enter...
- Subscribe to RSS Feed
- Mark Topic as New
- Mark Topic as Read
- Float this Topic for Current User
- Bookmark Topic
- Subscribe to Topic
- Mute Topic
- Printer Friendly Page
- Mark as New
- Bookmark Message
- Subscribe to Message
- Mute Message
- Subscribe to RSS Feed
- Permalink
- Report Inappropriate Content
When writing a custom search command, modular input, custom REST handler, alert action, or anything running Python in Splunk Enterprise, how can I use a debugger to set breakpoints, step into/over code, set variable watchers, inspect the call stack, etc.?
- Mark as New
- Bookmark Message
- Subscribe to Message
- Mute Message
- Subscribe to RSS Feed
- Permalink
- Report Inappropriate Content
User generated Python code running in Splunk Enterprise can be debugged using Visual Studio Code, and you get all the things you would expect in a debugger.
https://github.com/splunk/vscode-extension-splunk/wiki/Debugging
Prerequisites
- Splunk Enterprise - running in a data center or even a public cloud
- Microsoft Visual Studio Code Supporting Add-on for Splunk - enables Python code running in Splunk Enterprise to be debugged by Visual Studio Code
- Visual Studio Code
- Visual Studio Code Extension for Splunk - contains everything you need to get started debugging plus bonus features to interact with Splunk.
Overview
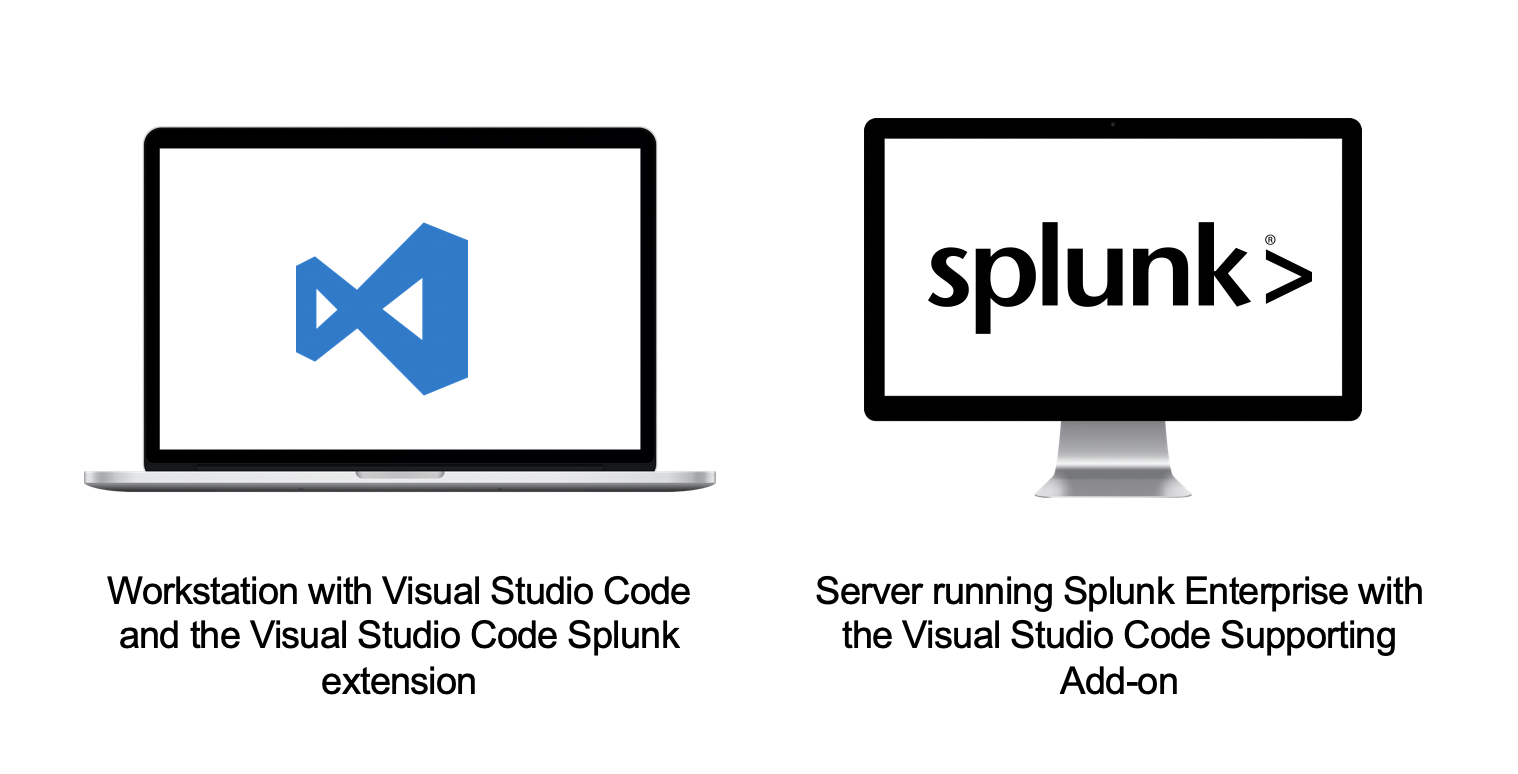
Logically, there are two components:
- A machine, like a workstation, running Visual Studio Code
- A machine running Splunk Enterprise software
Technically these things can run on the same logical machine; however, Visual Studio Code can run on a workstation while Splunk Enterprise runs in a remote data center or even a public cloud.
Each component requires specific software. The workstation running Visual Studio Code requires the Visual Studio Code Extension for Splunk. The server running Splunk Enterprise requires the Visual Studio Code Supporting Add-on for Splunk.
Workflow
First, on the Splunk Enterprise side, you will need to add a few lines of Python code to the component you want to debug. These lines of code enable the Visual Studio Code debugger to connect and debug the Python code running in Splunk Enterprise.
Next, start the component you want to debug on the Splunk Enterprise server. For instance, if you are debugging a modular input, create an instance of the input and enable it. If you are debugging a custom search command, start a Splunk search and invoke the command. If you are debugging a custom alert action, create a search to trigger the action. Basically, the code needs to be running in order Visual Studio Code to attach.
Finally, start the debugger in Visual Studio Code. This will attach Visual Studio Code to the running process in Splunk Enterprise and enable a familiar debug experience.
Debug Walkthrough
Modifying your code
In order to debug your Python code, some minor changes need to be made. Place the following in your Python file you would like to debug:
import sys, os
sys.path.append(os.path.join(os.environ['SPLUNK_HOME'],'etc','apps','SA-VSCode','bin'))
import splunk_debug as dbg
dbg.enable_debugging(timeout=25)
The above code does 2 main things:
- Appends the path of the supporting add-on to the Python path. This makes is possible for your code to import the necessary modules without copying them to your project.
- Starts the debug server for your code. The timeout parameter specifies how long, in seconds, the debug server will wait for Visual Studio Code to connect to the running process. If a connection is not made during this time period, the Python code will continue to run as normal.
Setting a break point (optional)
Breakpoints can be set in Visual Studio Code, or you can use the following line to force a breakpoint anywhere in your Python code:
dbg.set_breakpoint()
Configure debugging with debug.conf (optional)
The debugger can be configured for an app by creating a new file with the name debug.conf in the $SPLUNK_HOME/etc/apps/<app_directory>/local/ directory.
debug.conf
[debug]
enabled = <boolean>
* Set whether an app allows debugging
* Enabling debugging can delay execution and introduce artificial latency.  It is recommended to either remove debug code or disable debugging options for production.
* Default: true
Important: enabling debugging can delay execution and introduce artificial latency. It is recommended to either remove debug code or disable debugging options for production.
Starting the Visual Studio Code Debugger
Visual Studio Code attaches to your modified code using a debug configuration created by the supported add-on. This configuration is named "Splunk Enterprise: Python Debugger".
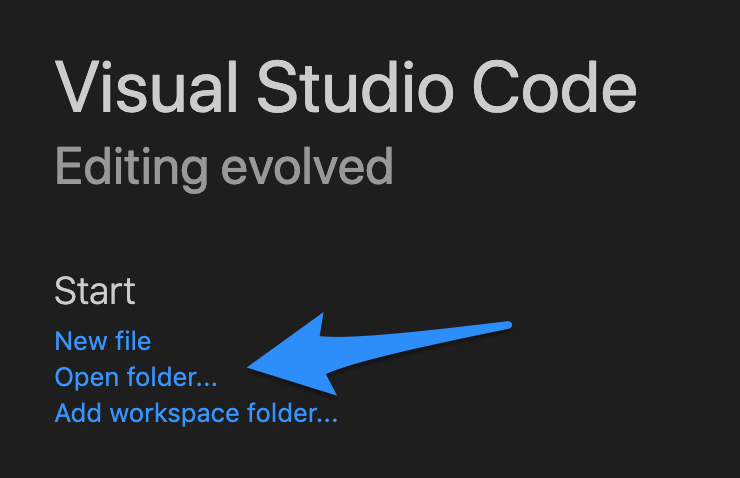
Step 1 - open your Splunk Enterprise folder in Visual Studio Code
It is necessary to open the folder in order for Visual Studio Code to read the debug configuration created by the supporting add-on.
After launching Visual Studio Code, choose Open folder...
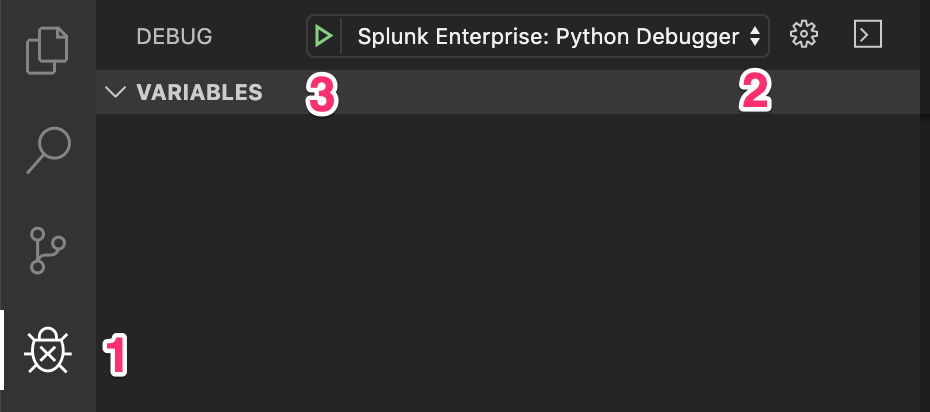
Step 2 – start the debugger
Once your Python code is running, perform the following steps in Visual Studio Code:
- Select debug from the Visual Studio Code side bar
- Choose the "Splunk Enterprise: Python Debugger" configuration
- Click the start debugging button
- Mark as New
- Bookmark Message
- Subscribe to Message
- Mute Message
- Subscribe to RSS Feed
- Permalink
- Report Inappropriate Content
We have Splunk Enterprise running on a VM in a data center. Can you provide some information on how this process would work in this case. Specifically, how would "open your Splunk Enterprise folder in Visual Studio Code" work?
Edit: some more info on connecting the debugger to a remote host can be found here: https://github.com/splunk/vscode-extension-splunk/issues/11
- Mark as New
- Bookmark Message
- Subscribe to Message
- Mute Message
- Subscribe to RSS Feed
- Permalink
- Report Inappropriate Content
Hello Sir
Did you able to get it run?
Thanks
- Mark as New
- Bookmark Message
- Subscribe to Message
- Mute Message
- Subscribe to RSS Feed
- Permalink
- Report Inappropriate Content
User generated Python code running in Splunk Enterprise can be debugged using Visual Studio Code, and you get all the things you would expect in a debugger.
https://github.com/splunk/vscode-extension-splunk/wiki/Debugging
Prerequisites
- Splunk Enterprise - running in a data center or even a public cloud
- Microsoft Visual Studio Code Supporting Add-on for Splunk - enables Python code running in Splunk Enterprise to be debugged by Visual Studio Code
- Visual Studio Code
- Visual Studio Code Extension for Splunk - contains everything you need to get started debugging plus bonus features to interact with Splunk.
Overview
Logically, there are two components:
- A machine, like a workstation, running Visual Studio Code
- A machine running Splunk Enterprise software
Technically these things can run on the same logical machine; however, Visual Studio Code can run on a workstation while Splunk Enterprise runs in a remote data center or even a public cloud.
Each component requires specific software. The workstation running Visual Studio Code requires the Visual Studio Code Extension for Splunk. The server running Splunk Enterprise requires the Visual Studio Code Supporting Add-on for Splunk.
Workflow
First, on the Splunk Enterprise side, you will need to add a few lines of Python code to the component you want to debug. These lines of code enable the Visual Studio Code debugger to connect and debug the Python code running in Splunk Enterprise.
Next, start the component you want to debug on the Splunk Enterprise server. For instance, if you are debugging a modular input, create an instance of the input and enable it. If you are debugging a custom search command, start a Splunk search and invoke the command. If you are debugging a custom alert action, create a search to trigger the action. Basically, the code needs to be running in order Visual Studio Code to attach.
Finally, start the debugger in Visual Studio Code. This will attach Visual Studio Code to the running process in Splunk Enterprise and enable a familiar debug experience.
Debug Walkthrough
Modifying your code
In order to debug your Python code, some minor changes need to be made. Place the following in your Python file you would like to debug:
import sys, os
sys.path.append(os.path.join(os.environ['SPLUNK_HOME'],'etc','apps','SA-VSCode','bin'))
import splunk_debug as dbg
dbg.enable_debugging(timeout=25)
The above code does 2 main things:
- Appends the path of the supporting add-on to the Python path. This makes is possible for your code to import the necessary modules without copying them to your project.
- Starts the debug server for your code. The timeout parameter specifies how long, in seconds, the debug server will wait for Visual Studio Code to connect to the running process. If a connection is not made during this time period, the Python code will continue to run as normal.
Setting a break point (optional)
Breakpoints can be set in Visual Studio Code, or you can use the following line to force a breakpoint anywhere in your Python code:
dbg.set_breakpoint()
Configure debugging with debug.conf (optional)
The debugger can be configured for an app by creating a new file with the name debug.conf in the $SPLUNK_HOME/etc/apps/<app_directory>/local/ directory.
debug.conf
[debug]
enabled = <boolean>
* Set whether an app allows debugging
* Enabling debugging can delay execution and introduce artificial latency.  It is recommended to either remove debug code or disable debugging options for production.
* Default: true
Important: enabling debugging can delay execution and introduce artificial latency. It is recommended to either remove debug code or disable debugging options for production.
Starting the Visual Studio Code Debugger
Visual Studio Code attaches to your modified code using a debug configuration created by the supported add-on. This configuration is named "Splunk Enterprise: Python Debugger".
Step 1 - open your Splunk Enterprise folder in Visual Studio Code
It is necessary to open the folder in order for Visual Studio Code to read the debug configuration created by the supporting add-on.
After launching Visual Studio Code, choose Open folder...
Step 2 – start the debugger
Once your Python code is running, perform the following steps in Visual Studio Code:
- Select debug from the Visual Studio Code side bar
- Choose the "Splunk Enterprise: Python Debugger" configuration
- Click the start debugging button
- Mark as New
- Bookmark Message
- Subscribe to Message
- Mute Message
- Subscribe to RSS Feed
- Permalink
- Report Inappropriate Content
could you please provide launch.json file for vs code debug? I don't have a built-in "Splunk Enterprise - python debugger" default option for debugging after installing the vs code extension for splunk
- Mark as New
- Bookmark Message
- Subscribe to Message
- Mute Message
- Subscribe to RSS Feed
- Permalink
- Report Inappropriate Content
I wanted to thank you for this Visual Studio extension. I saw the conf and its a complete game changer. It makes developing, troubleshooting and supporting inhouse app much more manageable . Thank you!!!!!

Join the Splunk Community Slack to learn, troubleshoot, and make connections with fellow Splunk practitioners in real time!
Join Splunk User Groups to connect and learn in-person by region or remotely by topic or industry.
What’s New in Splunk AI: Volume 02
Splunk App Dev Quarterly Roundup: AI, Agents, and Innovation!
Value Insights: Now Generally Available in the CMC
