Join the Conversation
- Find Answers
- :
- Apps & Add-ons
- :
- All Apps and Add-ons
- :
- All Apps and Add-ons
- :
- Re: Cisco eStreamer eNcore 4.0.9 Add-on for Splunk...
- Subscribe to RSS Feed
- Mark Topic as New
- Mark Topic as Read
- Float this Topic for Current User
- Bookmark Topic
- Subscribe to Topic
- Mute Topic
- Printer Friendly Page
- Mark as New
- Bookmark Message
- Subscribe to Message
- Mute Message
- Subscribe to RSS Feed
- Permalink
- Report Inappropriate Content
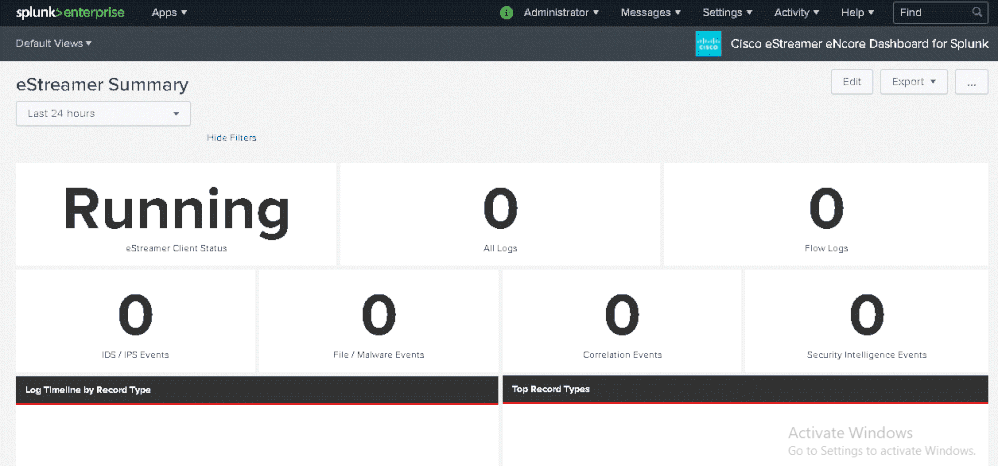
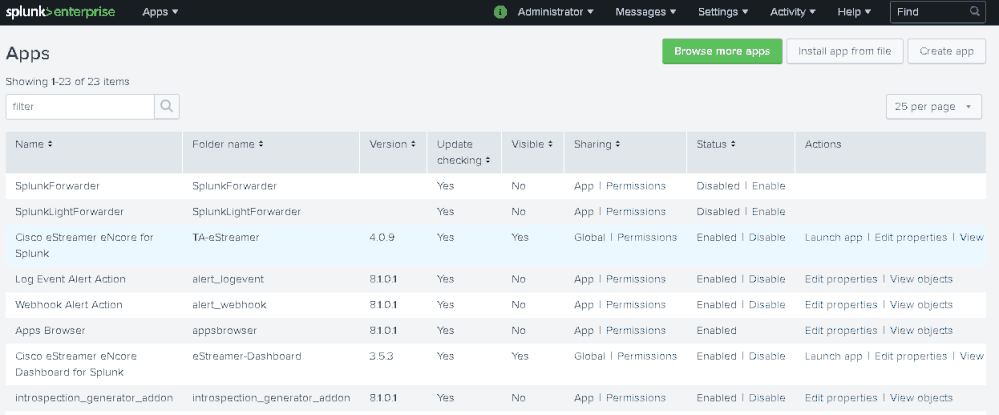
I'm running splunk 8.1.0.1 and Cisco eStreamer eNcore 4.0.9 and configured cisco FMC for estream integration but it doent show any logs. I have some Errors in splunkd.log and estreamer.log.
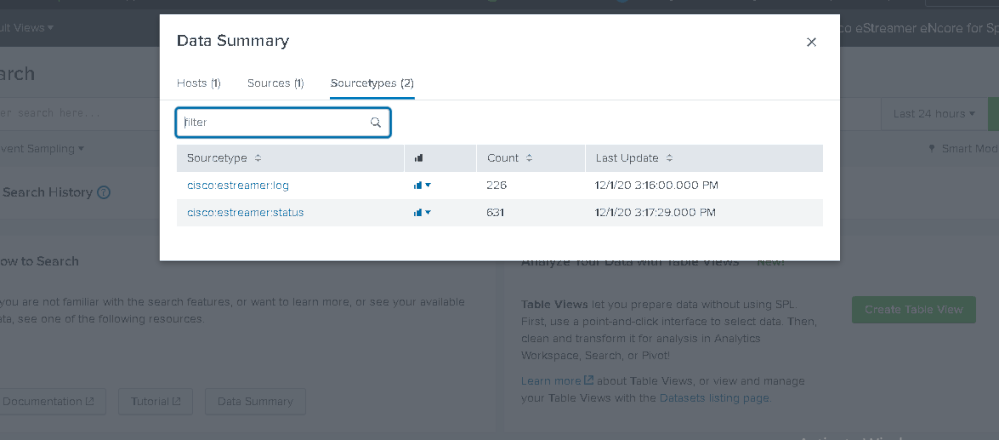
I dont receive any result when I search for
sourcetype="cisco:estreamer:data"
splunkd.log:
12-01-2020 10:55:45.104 +0330 INFO DatabaseDirectoryManager - Finished writing bucket manifest in hotWarmPath=/opt/splunk/var/lib/splunk/_telemetry/db duration=0.000
12-01-2020 10:56:16.088 +0330 WARN LocalAppsAdminHandler - Using deprecated capabilities for write: admin_all_objects or edit_local_apps. See enable_install_apps in limits.conf
12-01-2020 10:56:35.888 +0330 WARN CalcFieldProcessor - Invalid eval expression for 'EVAL-first_pkt_sec' in stanza [cisco:estreamer:data]: The expression is malformed. Expected AND.
12-01-2020 10:56:43.574 +0330 WARN CalcFieldProcessor - Invalid eval expression for 'EVAL-first_pkt_sec' in stanza [cisco:estreamer:data]: The expression is malformed. Expected AND.
12-01-2020 11:00:00.002 +0330 INFO ExecProcessor - setting reschedule_ms=3599998, for command=/opt/splunk/bin/python3.7 /opt/splunk/etc/apps/splunk_instrumentation/bin/instrumentation.py
12-01-2020 11:00:45.541 +0330 ERROR ExecProcessor - message from "/opt/splunk/etc/apps/TA-eStreamer/bin/splencore.sh clean" find: ‘../../data’: No such file or directory
12-01-2020 11:04:45.710 +0330 WARN LocalAppsAdminHandler - Using deprecated capabilities for write: admin_all_objects or edit_local_apps. See enable_install_apps in limits.conf
12-01-2020 11:09:16.851 +0330 WARN CalcFieldProcessor - Invalid eval expression for 'EVAL-first_pkt_sec' in stanza [cisco:estreamer:data]: The expression is malformed. Expected AND.
12-01-2020 11:09:47.042 +0330 WARN CalcFieldProcessor - Invalid eval expression for 'EVAL-first_pkt_sec' in stanza [cisco:estreamer:data]: The expression is malformed. Expected AND.
estreamer.log
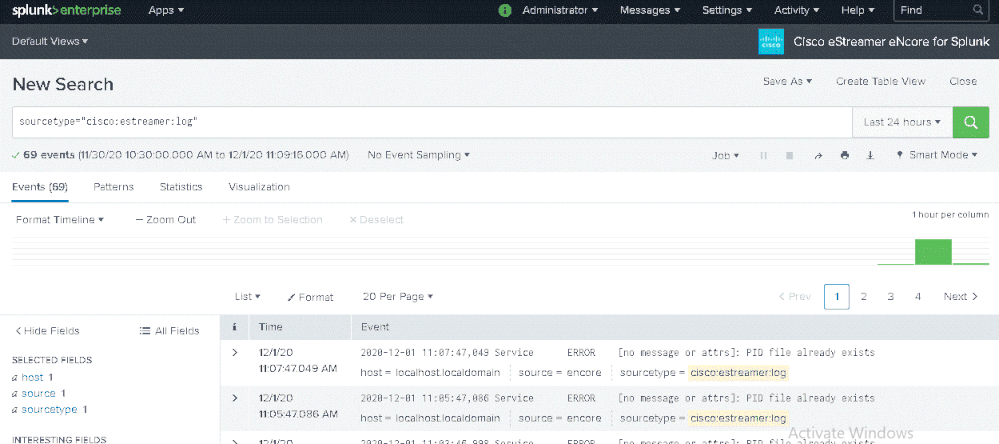
2020-12-01 10:57:47,097 Service ERROR [no message or attrs]: PID file already exists
2020-12-01 10:58:58,905 Monitor INFO Running. 3465700 handled; average rate 1604.32 ev/sec;
2020-12-01 10:59:47,105 Service ERROR [no message or attrs]: PID file already exists
2020-12-01 11:00:58,856 Monitor INFO Running. 3642600 handled; average rate 1597.5 ev/sec;
2020-12-01 11:01:47,003 Service ERROR [no message or attrs]: PID file already exists
2020-12-01 11:02:59,543 Monitor INFO Running. 3729700 handled; average rate 1553.92 ev/sec;
2020-12-01 11:03:46,998 Service ERROR [no message or attrs]: PID file already exists
2020-12-01 11:04:59,259 Monitor INFO Running. 3744100 handled; average rate 1485.59 ev/sec;
2020-12-01 11:05:47,086 Service ERROR [no message or attrs]: PID file already exists
2020-12-01 11:06:59,648 Monitor INFO Running. 3759600 handled; average rate 1423.95 ev/sec;
2020-12-01 11:07:47,049 Service ERROR [no message or attrs]: PID file already exists
2020-12-01 11:08:59,299 Monitor INFO Running. 3773900 handled; average rate 1367.29 ev/sec;
2020-12-01 11:09:47,126 Service ERROR [no message or attrs]: PID file already exists
2020-12-01 11:10:59,220 Monitor INFO Running. 3788200 handled; average rate 1315.21 ev/sec;
- Mark as New
- Bookmark Message
- Subscribe to Message
- Mute Message
- Subscribe to RSS Feed
- Permalink
- Report Inappropriate Content
Check the following things on the CLI:
/opt/splunk/etc/apps/TA-eStreamer/bin/splencore.sh test
should produce this message as the last line:
2020-12-02 22:27:20,963 Diagnostics INFO Connection successful
If it is success-full, check this command, if not skip to the next bit.
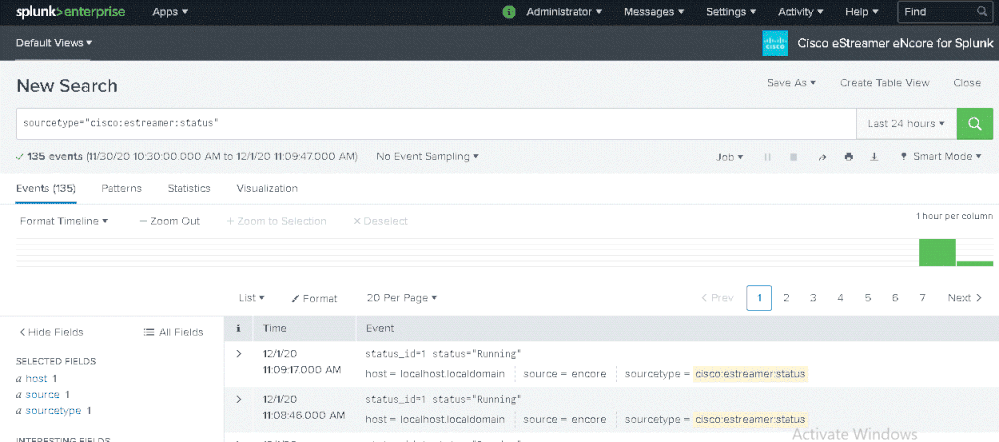
/opt/splunk/etc/apps/TA-eStreamer/bin/splencore.sh status
It should say:
status_id=1 status="Running"
If these things check out, but you still have errors, navigate to the TA-eStreamer bin directory, located in $SPLUNK_HOME/etc/apps/TA-eStreamer/bin. Open the splencore.sh with your favorite editor, look at the following and make sure it reflects your path:
#This is commented out by default, pleaes set this to the home
#directory of your Splunk Heavy Forwarder

SPLUNK_HOME=/opt/splunk

#This may be needed for CentOS, run this outside of the shell
LD_LIBRARY_PATH=/opt/splunk/lib
That got rid of the error messages. I did come from an upgrade. I decided to get rid of this deployment and followed these steps:
https://www.cisco.com/c/en/us/td/docs/security/firepower/670/api/eStreamer_enCore/eStreamereNcoreSpl...
I did find this in the inputs; the TA is looking for data to be written to: $SPLUNK_HOME/etc/apps/TA-eStreamer/data in the inputs.conf
# Where data is written to
[monitor://$SPLUNK_HOME/etc/apps/TA-eStreamer/data]
disabled = 0
source = encore
sourcetype = cisco:estreamer:data
crcSalt = <SOURCE>
This directory does not exist. Instead the files are written to:
/opt/splunk/etc/apps/TA-eStreamer/bin/encore/data/splunk- Mark as New
- Bookmark Message
- Subscribe to Message
- Mute Message
- Subscribe to RSS Feed
- Permalink
- Report Inappropriate Content
Apparently there is a new version of eStreamer available (4.2.0).. wondering if anyone used that version?
I'm using 4.0.9 and it stops working every 2, 3 days. when I run the status command below:
/opt/splunk/etc/apps/TA-eStreamer/bin/splencore.sh statusgetting this error:
Traceback (most recent call last):
  File "./estreamer/configure.py", line 38, in <module>
import estreamer.common.convert as convert
  File "/opt/splunk/etc/apps/TA-eStreamer/bin/encore/estreamer/__init__.py", line 28, in <module>
    from estreamer.connection import Connection
  File "/opt/splunk/etc/apps/TA-eStreamer/bin/encore/estreamer/connection.py", line 23, in <module>
    import ssl
  File "/opt/splunk/lib/python3.7/ssl.py", line 98, in <module>
    import _ssl             # if we can't import it, let the error propagate
ImportError: libssl.so.1.0.0: cannot open shared object file: No such file or directory
any recommendation to solve this? 🙂
- Mark as New
- Bookmark Message
- Subscribe to Message
- Mute Message
- Subscribe to RSS Feed
- Permalink
- Report Inappropriate Content
I am getting this exact issue. were you able to fix this ? if yes, please share steps.
Thanks!
- Mark as New
- Bookmark Message
- Subscribe to Message
- Mute Message
- Subscribe to RSS Feed
- Permalink
- Report Inappropriate Content
Hi,
Try following steps to clear out the memory so FMC logs start to flow again:
- Go to: /opt/splunk/etc/apps/TA-eStreamer/bin/encore
- Remove "A.A.A.A-8302_proc.pid"
- $ ps aux | grep estreamer
- pkill -9 -f service.py
- Restart Splunk services
I hope it helps!
With Regards
- Mark as New
- Bookmark Message
- Subscribe to Message
- Mute Message
- Subscribe to RSS Feed
- Permalink
- Report Inappropriate Content
I discovered a second bug with v4.0.9 of the addon. It worked for a few days, then suddenly it stopped. I found these errors in the estreamer.log file:
2020-12-17 13:46:17,854 Monitor      ERROR    [no message or attrs]: ProxyProcess[name=subscriberParser].request(status) timeout
2020-12-17 13:48:17,992 Monitor      ERROR    [no message or attrs]: ProxyProcess[name=subscriberParser].request(status) timeout
2020-12-17 13:50:17,883 Monitor      ERROR    [no message or attrs]: ProxyProcess[name=subscriberParser].request(status) timeout
2020-12-17 13:52:17,775 Monitor      ERROR    [no message or attrs]: ProxyProcess[name=subscriberParser].request(status) timeout
2020-12-17 13:54:17,910 Monitor      ERROR    [no message or attrs]: ProxyProcess[name=subscriberParser].request(status) timeout
2020-12-17 13:56:17,806 Monitor      ERROR    [no message or attrs]: ProxyProcess[name=subscriberParser].request(status) timeout
I tried restarting the addon and splunk multiple times but could never recover the connection. I opened a support case was advised of bug CSCvw88449 that also affects 4.0.9.
There are too many issues in 4.0.9 for me, so I decided to roll back to the latest 3.x version (3.7.1) and run on that. It seems to be stable.
- Mark as New
- Bookmark Message
- Subscribe to Message
- Mute Message
- Subscribe to RSS Feed
- Permalink
- Report Inappropriate Content
Thanks for the update. Does 3.7 run on Splunk 8.1.1? I thought that did not have python 3 support yet.
- Mark as New
- Bookmark Message
- Subscribe to Message
- Mute Message
- Subscribe to RSS Feed
- Permalink
- Report Inappropriate Content
I don't know if it runs on v8.1.1, I am running it on v8.0.5. But I have configured 8.0.5 to run python3 by default in etc/system/local/server.conf and the TA automation seems to run fine.
- Mark as New
- Bookmark Message
- Subscribe to Message
- Mute Message
- Subscribe to RSS Feed
- Permalink
- Report Inappropriate Content
I have the exact same issue, what helps is removing the pid file that exists in the following location:
$SPLUNK_HOME/etc/apps/TA-eStreamer/bin/encore
Then restart Splunk.
I have noticed that the issue returns after Splunk has been rebooted. I was about to start a thread on this subject.
- Mark as New
- Bookmark Message
- Subscribe to Message
- Mute Message
- Subscribe to RSS Feed
- Permalink
- Report Inappropriate Content
thank you for your reply. this error "Service ERROR [no message or attrs]: PID file already exists" resolved.
estreamer.log.
2020-12-01 15:00:59,454 Monitor INFO Running. 5325800 handled; average rate 319.29 ev/sec;
2020-12-01 15:02:00,726 Monitor INFO Running. 10800 handled; average rate 89.8 ev/sec;
2020-12-01 15:02:58,762 Monitor INFO Running. 5336200 handled; average rate 317.63 ev/sec;
2020-12-01 15:04:00,887 Monitor INFO Running. 21000 handled; average rate 87.4 ev/sec;
2020-12-01 15:04:59,552 Monitor INFO Running. 5345600 handled; average rate 315.93 ev/sec;
2020-12-01 15:06:00,267 Monitor INFO Running. 29500 handled; average rate 81.91 ev/sec;
2020-12-01 15:06:58,891 Monitor INFO Running. 5354100 handled; average rate 314.2 ev/sec;
2020-12-01 15:08:00,234 Monitor INFO Running. 39200 handled; average rate 81.62 ev/sec;
2020-12-01 15:08:59,062 Monitor INFO Running. 5364000 handled; average rate 312.58 ev/sec;
2020-12-01 15:10:00,882 Monitor INFO Running. 50400 handled; average rate 83.97 ev/sec;
2020-12-01 15:10:59,381 Monitor INFO Running. 5377100 handled; average rate 311.17 ev/sec;
2020-12-01 15:12:00,891 Monitor INFO Running. 63200 handled; average rate 87.76 ev/sec;
2020-12-01 15:12:58,983 Monitor INFO Running. 5388800 handled; average rate 309.7 ev/sec;
2020-12-01 15:13:59,918 Monitor INFO Running. 73300 handled; average rate 87.25 ev/sec;
but these errors persist in splunkd.log and there is nothing related to cisco:estreamer:data:
12-01-2020 15:02:04.720 +0330 WARN CalcFieldProcessor - Invalid eval expression for 'EVAL-first_pkt_sec' in stanza [cisco:estreamer:data]: The expression is malformed. Expected AND.
12-01-2020 15:02:17.575 +0330 WARN CalcFieldProcessor - Invalid eval expression for 'EVAL-first_pkt_sec' in stanza [cisco:estreamer:data]: The expression is malformed. Expected AND.
12-01-2020 15:09:14.101 +0330 WARN LocalAppsAdminHandler - Using deprecated capabilities for write: admin_all_objects or edit_local_apps. See enable_install_apps in limits.conf
12-01-2020 15:09:16.724 +0330 WARN LocalAppsAdminHandler - Using deprecated capabilities for write: admin_all_objects or edit_local_apps. See enable_install_apps in limits.conf
12-01-2020 15:09:57.608 +0330 WARN TelemetryMetricHandler - Could not retrieve CDS URL from quickdraw.
12-01-2020 15:14:58.055 +0330 ERROR ExecProcessor - message from "/opt/splunk/etc/apps/TA-eStreamer/bin/splencore.sh clean" find: ‘../../data’: No such file or directory
- Mark as New
- Bookmark Message
- Subscribe to Message
- Mute Message
- Subscribe to RSS Feed
- Permalink
- Report Inappropriate Content
Check the following things on the CLI:
/opt/splunk/etc/apps/TA-eStreamer/bin/splencore.sh test
should produce this message as the last line:
2020-12-02 22:27:20,963 Diagnostics INFO Connection successful
If it is success-full, check this command, if not skip to the next bit.
/opt/splunk/etc/apps/TA-eStreamer/bin/splencore.sh status
It should say:
status_id=1 status="Running"
If these things check out, but you still have errors, navigate to the TA-eStreamer bin directory, located in $SPLUNK_HOME/etc/apps/TA-eStreamer/bin. Open the splencore.sh with your favorite editor, look at the following and make sure it reflects your path:
#This is commented out by default, pleaes set this to the home
#directory of your Splunk Heavy Forwarder

SPLUNK_HOME=/opt/splunk

#This may be needed for CentOS, run this outside of the shell
LD_LIBRARY_PATH=/opt/splunk/lib
That got rid of the error messages. I did come from an upgrade. I decided to get rid of this deployment and followed these steps:
https://www.cisco.com/c/en/us/td/docs/security/firepower/670/api/eStreamer_enCore/eStreamereNcoreSpl...
I did find this in the inputs; the TA is looking for data to be written to: $SPLUNK_HOME/etc/apps/TA-eStreamer/data in the inputs.conf
# Where data is written to
[monitor://$SPLUNK_HOME/etc/apps/TA-eStreamer/data]
disabled = 0
source = encore
sourcetype = cisco:estreamer:data
crcSalt = <SOURCE>
This directory does not exist. Instead the files are written to:
/opt/splunk/etc/apps/TA-eStreamer/bin/encore/data/splunk- Mark as New
- Bookmark Message
- Subscribe to Message
- Mute Message
- Subscribe to RSS Feed
- Permalink
- Report Inappropriate Content
I have a TAC case open with Cisco and I'm trying to get put in touch with the developers of the TA so I can communicate the problem to them, and hopefully get them to update either the logging path in the python code or the monitor stanza in inputs.conf.
- Mark as New
- Bookmark Message
- Subscribe to Message
- Mute Message
- Subscribe to RSS Feed
- Permalink
- Report Inappropriate Content
I emailed encore-community@cisco.com notifying them on 12/10, as well as to change the splencore.sh to reflect the correct path for cleaning. They said they would fix on the next upgrade.
I also noticed there are other issues such as the knowledge bundle sizes that are being created. I think it's best to roll back for now until they fix all other issues.
- Mark as New
- Bookmark Message
- Subscribe to Message
- Mute Message
- Subscribe to RSS Feed
- Permalink
- Report Inappropriate Content
I'm curious about where you found that email address? Opening a TAC case and getting in touch with an engineer who knew what Splunk is was a challenge for me. I would definitely have tried your approach if I knew about that email address.
- Mark as New
- Bookmark Message
- Subscribe to Message
- Mute Message
- Subscribe to RSS Feed
- Permalink
- Report Inappropriate Content
I had it from a while ago. It was in their documentation from v3.5 under support. They probably prefer users to use TAC though.
- Mark as New
- Bookmark Message
- Subscribe to Message
- Mute Message
- Subscribe to RSS Feed
- Permalink
- Report Inappropriate Content
Another quick update. A bug was filed on the issue on 11/20/2020, CSCvw51040. So Cisco is aware and they are working on it.
- Mark as New
- Bookmark Message
- Subscribe to Message
- Mute Message
- Subscribe to RSS Feed
- Permalink
- Report Inappropriate Content
Have you had any better luck with 4.0.11?
I had a lot of issues with 4.0.9 (back in Oct-Nov) but at a certain point I was hitting the following errors and I couldn't ingest data so I had to downgrade.
root INFO 'View' object has no attribute '_View__isHex'
Decorator ERROR [no message or attrs]: 'View' object has no attribute '_View__isHex'\n'View' object has no attribute '_View__isHex'Traceback (most recent call last):\n...............
I am just noticing my issue seems different than yours but they related it to the same bug
- Mark as New
- Bookmark Message
- Subscribe to Message
- Mute Message
- Subscribe to RSS Feed
- Permalink
- Report Inappropriate Content
- Mark as New
- Bookmark Message
- Subscribe to Message
- Mute Message
- Subscribe to RSS Feed
- Permalink
- Report Inappropriate Content
I have become intimately familiar with the eStreamer TA over the last couple of years. Let me see if I can help with some of these.
setup.xml was removed in v4.0.x, so the configuration that was previously done with two passes through setup.xml in the GUI or TA-eStreamer/local/encore.conf now has to be done by manually editing the TA-eStreamer/bin/encore/estreamer.conf file, which is not nearly as easy-peasy as using the GUI.
Packets, Connections, & Metadata
(not mentioned earlier - but seems worth noting since it could be a data hog and is completely left out of the new instructions)
In addition to manually enabling and setting the hosts in TA-eStreamer/bin/encore/estreamer.conf, you also have to manually enable/disable packets, connections, and metadata options that were previously available via checkboxes on the bottom of the setup page.
- packets are enabled by default - which could be problematic since packet data is quite large
- these options are in the "records" section of estreamer.conf
- as info, our previous configuration which had connections enabled, but packets and metadata disabled is below.
"records": {
    "connections": true,
    "core": true,
    "excl@comment": [
	"These records will be excluded regardless of above (overrides 'include')",
	"e.g. to exclude flow and IPS events use [ 71, 400 ]"
    ],
    "exclude": [],
    "inc@comment": "These records will be included regardless of above",
    "include": [],
    "intrusion": true,
    "metadata": false,
    "packets": false,
    "rna": true,
    "rua": true
}
},
Data Directory Change (affects inputs.conf & clean() function of splencore.sh script)
As noted above the data directory has changed to TA-eStreamer/bin/encore/data/splunk/
- The filename format has also changed from encore.EPOCHTIME.log to encore.logEPOCHTIME
There are multiple ways you can address this. Either change where the data lives or point everything to the new locale.
Change Where the Data Lives
Update the "uri" in the "handler" section of TA-eStreamer/bin/encore/estreamer.conf back to the old value:
"uri": "relfile:///../../data/encore.{0}.log"
Update Where the App Looks
Add a new monitor stanza in TA-eStreamer/local/inputs.conf for the new data path:
[monitor://$SPLUNK_HOME/etc/apps/TA-eStreamer/bin/encore/data/splunk]
Update the path in the clean() stanza of the TA-eStreamer/bin/splencore.sh script to the new data path:
clean() {
    # Delete data older than 12 hours -> 720mins
    # find ../../data -type f -mmin +720 -delete
    # correcting path to new path in new version 4.0.11 of TA
    find $SPLUNK_HOME/etc/apps/TA-eStreamer/bin/encore/data/splunk -type f -mmin +720 -delete
}
first_pkt_sec EVAL Error
The EVAL statement triggering the error looks like it was a FIELDALIAS that someone switched over to an EVAL without actually switching it.
The culprit:
EVAL-first_pkt_sec = event_sec as first_pkt_sec
The fancy EVAL we wrote to address this coalesces several time fields to ensure the 'first_pkt_sec' field gets populated.
EVAL-first_pkt_sec = coalesce(first_pkt_sec, connection_sec, event_sec)
You could also accomplish this with a simple eval that will override the EVAL triggering the issue.
EVAL-first_pkt_sec = event_sec
Other Props Fixes
We also noted that the search-time props had conflicting FIELDALIAS functions, no KV_MODE, and a few other things; so we added some additional flare to address those issues. Just in case this might also be helpful.
[cisco:estreamer:data]
#### Setting the time format to epoch time (not set in TA)
TIME_FORMAT = %s

#### Setting KV_MODE ####
KV_MODE = auto

#### Splunk CIM - Intrusion Detection Fields ####
EVAL-severity = coalesce(severity, priority)
EVAL-signature = coalesce(case(signature="",null(),true(),signature), detection, msg)

#### Splunk CIM - Malware Fields ####
EVAL-url = coalesce(url, uri)
If it wasn't clear - the first_pkt_sec and "other props fixes" were all applied to our TA-eStreamer/local/props.conf file.
- Mark as New
- Bookmark Message
- Subscribe to Message
- Mute Message
- Subscribe to RSS Feed
- Permalink
- Report Inappropriate Content
Hi,
Actually I've installed the new released version (4.2.2) and only changed the monitor stanza to monitor the right path:
[monitor://$SPLUNK_HOME/etc/apps/TA-eStreamer/bin/encore/data/splunk]the new version is working well now, except the clean stanza, which even changing the path doesn't seem to work. I also reduced the time to +10 minutes, but still no joy:
clean() {
    # Delete data older than 12 hours -> 720mins
    # find ../../data -type f -mmin +720 -delete
    # correcting path to new path in new version 4.2.2 of TA
    find $SPLUNK_HOME/etc/apps/TA-eStreamer/bin/encore/data/splunk -type f -mmin +10 -delete
}
I'm wondering if there is any recommended work around to fix this.
Thank you in advance.
- Mark as New
- Bookmark Message
- Subscribe to Message
- Mute Message
- Subscribe to RSS Feed
- Permalink
- Report Inappropriate Content
I found one more thing today when I was testing the v4.0.11 update. I noticed that the estreamer.conf process wasn't stopping when I stopped splunk and that the .pid file wasn't getting deleted when splunk stopped either. It was almost like the estreamer process wasn't dependent on the splunk service.
After running a diff command against the estreamer.conf from v3.6.8 and the new one for v4.0.11, I noticed that was exactly what happened. The part of the script noting that it should be depending on splunk has been removed.
Adding lines 2-4 back to the TA-eStreamer/bin/encore/estreamer.conf file re-added the splunk service dependency.
{
    "conditions": [
        "splunk"
],- Mark as New
- Bookmark Message
- Subscribe to Message
- Mute Message
- Subscribe to RSS Feed
- Permalink
- Report Inappropriate Content
Can you please state where exactly you added lines 2-4? Did you add the bracket to the end of the file or did you insert it all at lines 2-4?
Additionally, don't forget to re-add the tags file for CIM purposes.
