Are you a member of the Splunk Community?
- Find Answers
- :
- Using Splunk
- :
- Other Using Splunk
- :
- Alerting
- :
- Why is my simple alert not firing?
- Subscribe to RSS Feed
- Mark Topic as New
- Mark Topic as Read
- Float this Topic for Current User
- Bookmark Topic
- Subscribe to Topic
- Mute Topic
- Printer Friendly Page
- Mark as New
- Bookmark Message
- Subscribe to Message
- Mute Message
- Subscribe to RSS Feed
- Permalink
- Report Inappropriate Content
I have a simple scheduled search that is running every 5 minute. The search runs fine and I can see there are results, normally between 10-20 results. The alert trigger is set to 'Trigger Condition: Number of Results is > 1' However I never get an alert trigger to occur.
I have checked the Splunk logs and the scheduler has 100% successful runs. I am not sure what could be the reason for this not sending an alert.
Trial expires in May.
-David
- Mark as New
- Bookmark Message
- Subscribe to Message
- Mute Message
- Subscribe to RSS Feed
- Permalink
- Report Inappropriate Content
What is the lag time between when an event is created and when it is indexed?
Consider this example: On a production server, an application writes to abc.log at 8:59:59. The Splunk forwarder sees that abc.log has been modified and collects the data, sending it to the indexer. The data is parsed and written to the main index at 9:00:03 - a 3 second delay (which is pretty quick).
In the meantime, a search is running on the indexer every minute, searching the prior minute's data. Here is a table of the recent executions:
Search runs at:   Start Time:   End Time:
8:59:00             8:58:00      8:59:00
9:00:00             8:59:00      9:00:00
9:01:00             9:00:00      9:01:00
When the search runs at 8:59:00, the event has not yet happened.
When the search runs at 9:00:00, the event from abc.log has not yet been indexed, so it does not appear in the results.
When the search runs at 9:01:00, the event from abc.log exists in the main index, but its timestamp is 8:59:59 - so it is outside the time range of the search! The event will not be part of any search results, so the alert will not be triggered.
While I still think that something else may be going wrong with your searches, you will alway risk "missing" events when you do not consider the lag time between when an event occurs on a machine and when the information is indexed. You have 2 choices:
1 - Run a realtime search. This can be quite expensive, but you will not miss events.
2 - Run a scheduled search, but include a lag time. To include a 1-minute lag, your search could be
Your search time range: earliest=-2m@m latest=-1m@m (starting 2 minutes ago, and ending 1 minute ago)
Cron schedule: */1 * * * * (run every minute)
This works if there is less than a 1 minute delay between when the events occur and when they are indexed.
Finally, you might want to look at the Splunk Monitoring Console. There is a dashboard for examining scheduled search activity. You may find that not all of your scheduled searches are being run, or that there are other problems in the environment.
- Mark as New
- Bookmark Message
- Subscribe to Message
- Mute Message
- Subscribe to RSS Feed
- Permalink
- Report Inappropriate Content
It may just be you need an explicit "field" statement at the end.
See:
- Mark as New
- Bookmark Message
- Subscribe to Message
- Mute Message
- Subscribe to RSS Feed
- Permalink
- Report Inappropriate Content
What is the lag time between when an event is created and when it is indexed?
Consider this example: On a production server, an application writes to abc.log at 8:59:59. The Splunk forwarder sees that abc.log has been modified and collects the data, sending it to the indexer. The data is parsed and written to the main index at 9:00:03 - a 3 second delay (which is pretty quick).
In the meantime, a search is running on the indexer every minute, searching the prior minute's data. Here is a table of the recent executions:
Search runs at:   Start Time:   End Time:
8:59:00             8:58:00      8:59:00
9:00:00             8:59:00      9:00:00
9:01:00             9:00:00      9:01:00
When the search runs at 8:59:00, the event has not yet happened.
When the search runs at 9:00:00, the event from abc.log has not yet been indexed, so it does not appear in the results.
When the search runs at 9:01:00, the event from abc.log exists in the main index, but its timestamp is 8:59:59 - so it is outside the time range of the search! The event will not be part of any search results, so the alert will not be triggered.
While I still think that something else may be going wrong with your searches, you will alway risk "missing" events when you do not consider the lag time between when an event occurs on a machine and when the information is indexed. You have 2 choices:
1 - Run a realtime search. This can be quite expensive, but you will not miss events.
2 - Run a scheduled search, but include a lag time. To include a 1-minute lag, your search could be
Your search time range: earliest=-2m@m latest=-1m@m (starting 2 minutes ago, and ending 1 minute ago)
Cron schedule: */1 * * * * (run every minute)
This works if there is less than a 1 minute delay between when the events occur and when they are indexed.
Finally, you might want to look at the Splunk Monitoring Console. There is a dashboard for examining scheduled search activity. You may find that not all of your scheduled searches are being run, or that there are other problems in the environment.
- Mark as New
- Bookmark Message
- Subscribe to Message
- Mute Message
- Subscribe to RSS Feed
- Permalink
- Report Inappropriate Content
I believe you are on the right track, that things are not set up correctly. I added an additional, none email alert, and that is working. I believe the issue now is related to the Email service, not Splunk. Thank you for the help in troubleshooting.
- Mark as New
- Bookmark Message
- Subscribe to Message
- Mute Message
- Subscribe to RSS Feed
- Permalink
- Report Inappropriate Content
Right now my earliest - 1h. The run time of every minute was to make the system run more often just to get the test completed faster. I have changed this schedule to every 5 mins and every 15 mins but it is still not firing.
I will take a look at the Splunk Monitoring Console.
- Mark as New
- Bookmark Message
- Subscribe to Message
- Mute Message
- Subscribe to RSS Feed
- Permalink
- Report Inappropriate Content
I have looked into the Splunk Monitoring Console and the Alerts section shows 0 alerts triggered.
I have the search running every 5 mins just incase there is an issue with the every minute search.
I still see 0 alerts.
- Mark as New
- Bookmark Message
- Subscribe to Message
- Mute Message
- Subscribe to RSS Feed
- Permalink
- Report Inappropriate Content
When you look at the saved search and "recent runs", do they show any results?
- Mark as New
- Bookmark Message
- Subscribe to Message
- Mute Message
- Subscribe to RSS Feed
- Permalink
- Report Inappropriate Content
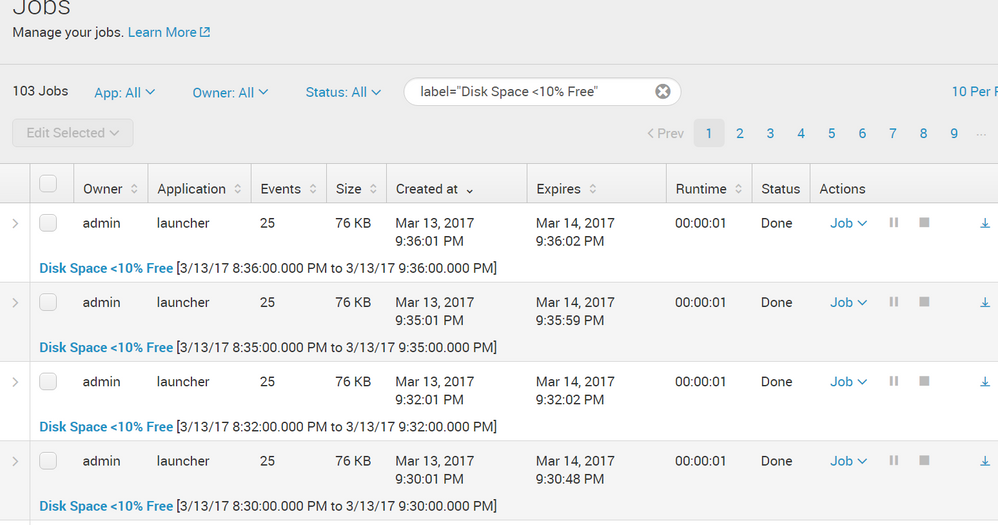
I see a run every minute, for the past 2 hours, with over 20 items each.
- Mark as New
- Bookmark Message
- Subscribe to Message
- Mute Message
- Subscribe to RSS Feed
- Permalink
- Report Inappropriate Content
- Mark as New
- Bookmark Message
- Subscribe to Message
- Mute Message
- Subscribe to RSS Feed
- Permalink
- Report Inappropriate Content
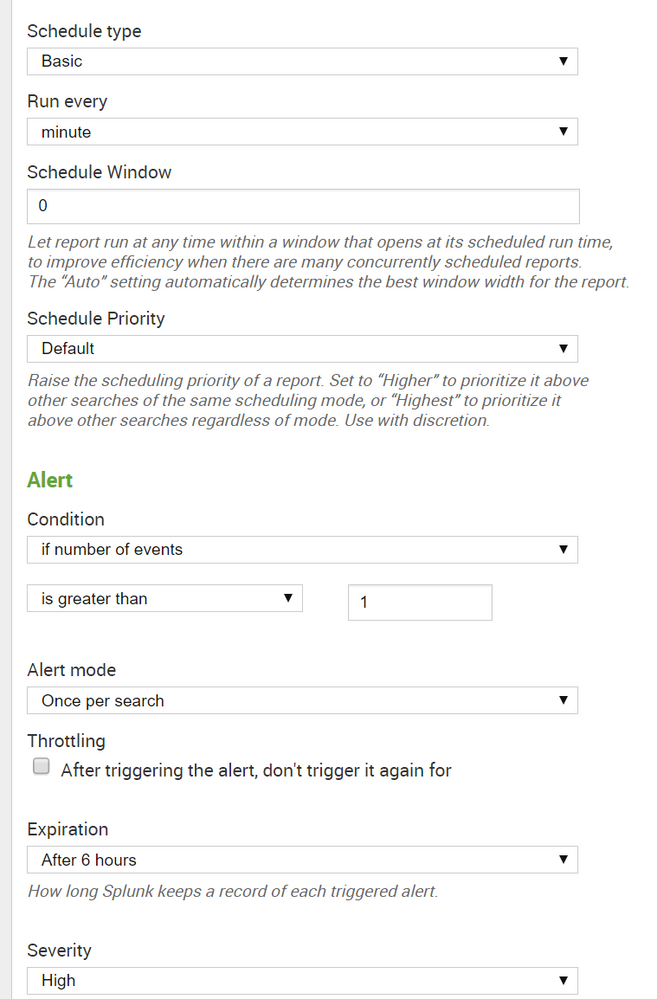
Why "greater than" 1? It should be 0.
- Mark as New
- Bookmark Message
- Subscribe to Message
- Mute Message
- Subscribe to RSS Feed
- Permalink
- Report Inappropriate Content
What is the alert search query?
- Mark as New
- Bookmark Message
- Subscribe to Message
- Mute Message
- Subscribe to RSS Feed
- Permalink
- Report Inappropriate Content
source="Perfmon*" counter="% Free Space" Value<60
Condition - If Number of Events - is greater than - 1
- Mark as New
- Bookmark Message
- Subscribe to Message
- Mute Message
- Subscribe to RSS Feed
- Permalink
- Report Inappropriate Content
How do you know it is not triggering? Is it here?
| rest/servicesNS/-/-/alerts/fired_alerts
| search NOT title="-"
- Mark as New
- Bookmark Message
- Subscribe to Message
- Mute Message
- Subscribe to RSS Feed
- Permalink
- Report Inappropriate Content
That returns 0 results. I see recent activity showing the searches and results. Then I see 0 alerts in the 'searches, reports, and alerts' for the 1 search. In addition the alert was set to trigger an email, which it is not doing.


