Join the Conversation
- Find Answers
- :
- Using Splunk
- :
- Other Using Splunk
- :
- Alerting
- :
- Trigger without alert?
- Subscribe to RSS Feed
- Mark Topic as New
- Mark Topic as Read
- Float this Topic for Current User
- Bookmark Topic
- Subscribe to Topic
- Mute Topic
- Printer Friendly Page
- Mark as New
- Bookmark Message
- Subscribe to Message
- Mute Message
- Subscribe to RSS Feed
- Permalink
- Report Inappropriate Content
Hi,
temperature sourcetype=kaa | rex field=_raw "\"endpointKeyHash\":\{\"string\":\"(?<endpoint>[^\"]*)\".*\"Event\": (?<mydata>\{.*\})\}$"| spath input=mydata | table _time, endpoint, temperature | eval threshold = 50 | where temperature > threshold
Is it possible to use Marker Gauge in Visualization to show that there is a trigger of temperature above 50?
- Mark as New
- Bookmark Message
- Subscribe to Message
- Mute Message
- Subscribe to RSS Feed
- Permalink
- Report Inappropriate Content
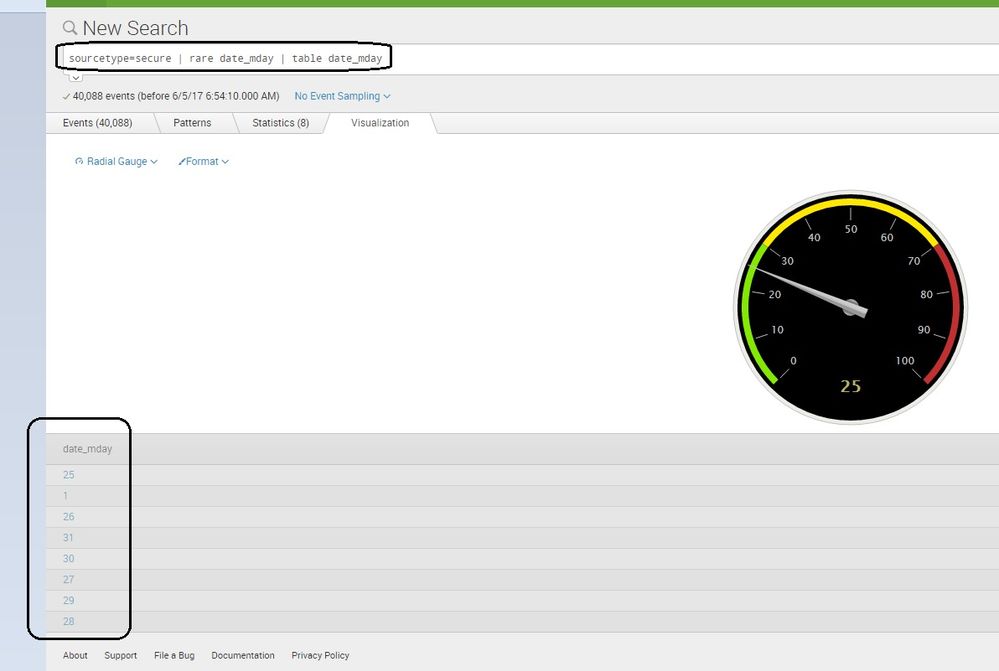
(as a comment, i can not attach the photo.. thus adding as an answer)
temperature sourcetype=kaa | rex field=_raw "\"endpointKeyHash\":\{\"string\":\"(?<endpoint>[^\"]*)\".*\"Event\": (?<mydata>\{.*\})\}$"| spath input=mydata | table temperature
Yes, this will work..
table temperature will give you a single column and the first value of the column will be shown on the gauge. also below the gauge you will get a list of other values.
Is it possible to fixed the gauge even after the temperature goes down below 50 after a spike? ///
it should work i think. you can format the gauge with two colors (green for below 50, red for above 50 and i think you need to run a "real time" search. the gauge will automatically show the value as it changes. )
Sekar
PS - If this or any post helped you in any way, pls consider upvoting, thanks for reading !
- Mark as New
- Bookmark Message
- Subscribe to Message
- Mute Message
- Subscribe to RSS Feed
- Permalink
- Report Inappropriate Content
Hi Wuming79, can you give us more info please...
the gauge can be used when we get only one result (a single value result).
like, the count of servers, count of errors, etc..
more details -
https://docs.splunk.com/Documentation/Splunk/6.6.1/Viz/CreateGauges
Sekar
PS - If this or any post helped you in any way, pls consider upvoting, thanks for reading !
- Mark as New
- Bookmark Message
- Subscribe to Message
- Mute Message
- Subscribe to RSS Feed
- Permalink
- Report Inappropriate Content
My live logs are showing temperature of a device. I like to use dashboard to display the temperature of the live input when it goes over 50. As I can't use the alert feature because the feature was disabled, I like to use dashboard as an alternative for the time being to show that I can see the temperature is over the threshold of 50C.
- Mark as New
- Bookmark Message
- Subscribe to Message
- Mute Message
- Subscribe to RSS Feed
- Permalink
- Report Inappropriate Content
I figured I could just use the search below to display single column. Is it possible to fixed the gauge even after the temperature goes down below 50 after a spike?
temperature sourcetype=kaa | rex field=_raw "\"endpointKeyHash\":\{\"string\":\"(?<endpoint>[^\"]*)\".*\"Event\": (?<mydata>\{.*\})\}$"| spath input=mydata | table temperature

