- Find Answers
- :
- Using Splunk
- :
- Other Using Splunk
- :
- Alerting
- :
- How to get duration between a start and stop event...
- Subscribe to RSS Feed
- Mark Topic as New
- Mark Topic as Read
- Float this Topic for Current User
- Bookmark Topic
- Subscribe to Topic
- Mute Topic
- Printer Friendly Page
- Mark as New
- Bookmark Message
- Subscribe to Message
- Mute Message
- Subscribe to RSS Feed
- Permalink
- Report Inappropriate Content
Hi,
i am new to the splunk and i do have a search which returns a service stopped from windows application event log.from the results i can see when the service does not start automatically(usually if there is a gap greater than 1-2 mins between start and stop).service stops and in less than 20 secs it starts back again.
here is my search
sourcetype="WMI:WinEventLog:Application" SourceName="Word Processing Service" Message="*"
and here are the results;
9/7/17
11:08:15.000 AM
20170907110815.000000
Category=0
CategoryString=NULL
EventCode=0
EventIdentifier=0
EventType=3
Logfile=Application
RecordNumber=264012
SourceName=Word Processing Service
TimeGenerated=20170907150815.000000-000
TimeWritten=20170907150815.000000-000
Type=Information
User=NULL
ComputerName=x
wmi_type=WinEventLog:Application
Message=Service stopped successfully.

9/7/17
11:08:20.000 AM
20170907110820.000000
Category=0
CategoryString=NULL
EventCode=0
EventIdentifier=0
EventType=3
Logfile=Application
RecordNumber=264016
SourceName=Word Processing Service
TimeGenerated=20170907150820.000000-000
TimeWritten=20170907150820.000000-000
Type=Information
User=NULL
ComputerName=x
wmi_type=WinEventLog:Application
Message=Service started successfully.
in reality i want to create an alert and when that gap happens and service does not start back in lets say, in 2 mins send an email out.i did find another post about this but not quite the same,or maybe it is the same but like i said i am new to this and was not able to apply it to my case.here is the link for that post
https://answers.splunk.com/answers/524252/how-to-get-duration-between-a-start-and-stop-event.html
Any help you can provide is greatly appreciated.
Thanks
- Mark as New
- Bookmark Message
- Subscribe to Message
- Mute Message
- Subscribe to RSS Feed
- Permalink
- Report Inappropriate Content
Assuming that there are ONLY 2 types of Message values, like this:
index=YouShouldAlwaysSpecifyAnIndex sourcetype="WMI:WinEventLog:Application" SourceName="Word Processing Service" Message="*"
| streamstats count(eval(Message="Service stopped successfully.")) AS sessionID BY host
| stats range(_time) AS downTimeSeconds count AS messages values(Message) AS Messages
| eval now=now()
| eval downTimeSeconds = if((messages=1), now - _time, downTimeSeconds)
| where downTimeSeconds > 2*60
- Mark as New
- Bookmark Message
- Subscribe to Message
- Mute Message
- Subscribe to RSS Feed
- Permalink
- Report Inappropriate Content
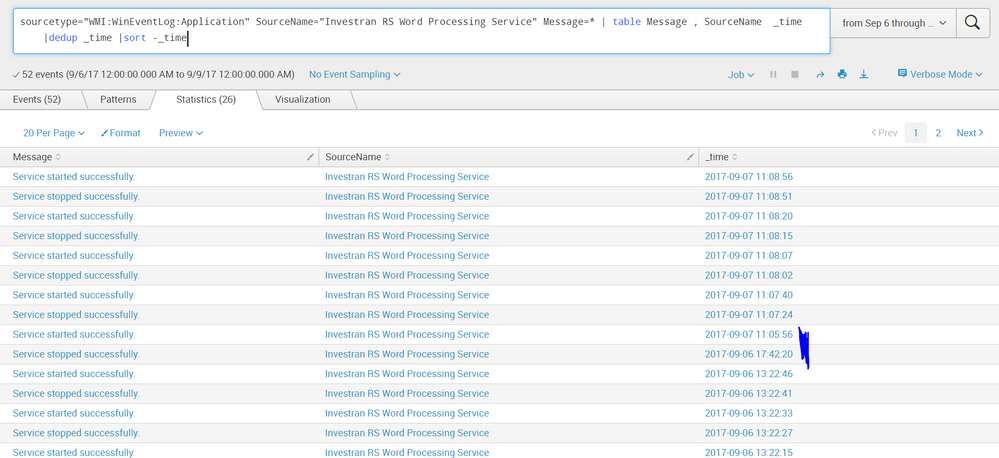
i've attached a screenshot and i hope that helps.the blue highlighted part is what i am looking for.as you can see from the data, the service in question stops and starts in seconds,but when it doesn't ,all hell brakes loose.so if possible i want to be alerted thru splunk when that happens.as the pattern shows from the log that service recovers fairly quick and if not, like the one below i wanna pull that information from the log file which is windows application event log.
Thanks
- Mark as New
- Bookmark Message
- Subscribe to Message
- Mute Message
- Subscribe to RSS Feed
- Permalink
- Report Inappropriate Content
Assuming that there are ONLY 2 types of Message values, like this:
index=YouShouldAlwaysSpecifyAnIndex sourcetype="WMI:WinEventLog:Application" SourceName="Word Processing Service" Message="*"
| streamstats count(eval(Message="Service stopped successfully.")) AS sessionID BY host
| stats range(_time) AS downTimeSeconds count AS messages values(Message) AS Messages
| eval now=now()
| eval downTimeSeconds = if((messages=1), now - _time, downTimeSeconds)
| where downTimeSeconds > 2*60
- Mark as New
- Bookmark Message
- Subscribe to Message
- Mute Message
- Subscribe to RSS Feed
- Permalink
- Report Inappropriate Content
yeah, not sure if this is going to work.for the sourcetype"word processing service" i get 2 messages,1 "service stopped successfully" and 2 "service started successfully".and when the service stops it causes bunch of errors so i need to tell splunk when there is a minute gap between services(stopped and not started)i need an alert set an send me an email if possible.
or better yet,from that search if only i can bring the results where there is a big gap between stop and start services for "word processing service".i guess when i initially created my post i over complicated the process.i hope this make sense,if not ,i'd appreciate you guys taking the time to respond.
this is where the service stopped on 6th;
9/6/17
5:42:20.000 PM
20170906174220.000000
Category=0
CategoryString=NULL
EventCode=0
EventIdentifier=0
EventType=3
Logfile=Application
RecordNumber=263910
SourceName=Word Processing Service
TimeGenerated=20170906214220.000000-000
TimeWritten=20170906214220.000000-000
Type=Information
User=NULL
ComputerName=x
wmi_type=WinEventLog:Application
Message=Service stopped successfully.
and this is where the service started back up the next day;
9/7/17
11:05:56.000 AM
20170907110556.000000
Category=0
CategoryString=NULL
EventCode=0
EventIdentifier=0
EventType=3
Logfile=Application
RecordNumber=263954
SourceName=Word Processing Service
TimeGenerated=20170907150556.000000-000
TimeWritten=20170907150556.000000-000
Type=Information
User=NULL
ComputerName=x
wmi_type=WinEventLog:Application
Message=Service started successfully.
- Mark as New
- Bookmark Message
- Subscribe to Message
- Mute Message
- Subscribe to RSS Feed
- Permalink
- Report Inappropriate Content
I am totally lost. I'll have to tap out if you cannot regroup and show concrete examples of logs that happen for each case.
- Mark as New
- Bookmark Message
- Subscribe to Message
- Mute Message
- Subscribe to RSS Feed
- Permalink
- Report Inappropriate Content
Which of the timestamps do you want to use? I see three in the events, and there could be a fourth if _time doesn't come from one of those.
Do you have a way to correlate the two events (like with the transaction command)? Or are you potentially having windows that will span days or months?
Are you just interested in the last two events?

