- Find Answers
- :
- Using Splunk
- :
- Other Using Splunk
- :
- Alerting
- :
- How to create splunk alert using config files?
- Subscribe to RSS Feed
- Mark Topic as New
- Mark Topic as Read
- Float this Topic for Current User
- Bookmark Topic
- Subscribe to Topic
- Mute Topic
- Printer Friendly Page
- Mark as New
- Bookmark Message
- Subscribe to Message
- Mute Message
- Subscribe to RSS Feed
- Permalink
- Report Inappropriate Content
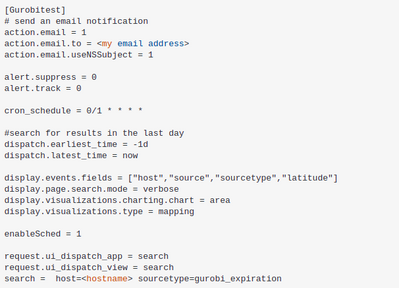
I created savedsearches.conf file to create a splunk alert and restart the splunk service, but I still can't see the new alert in the UI, I am using the following configuration:
Thanks in advance!
- Mark as New
- Bookmark Message
- Subscribe to Message
- Mute Message
- Subscribe to RSS Feed
- Permalink
- Report Inappropriate Content
The inputs.conf is for data collection which can happen on both Splunk Universal Forwarder and Splunk enterprise. The alerting (which is basically scheduled searching) happens only on Splunk Enterprise instances, commonly on your Search Heads. Instead of creating the alert on UF, place it on your Search Head (where you're searching the data).
- Mark as New
- Bookmark Message
- Subscribe to Message
- Mute Message
- Subscribe to RSS Feed
- Permalink
- Report Inappropriate Content
At what location did you place the savedsearches.conf? Are you looking at correct app context?
- Mark as New
- Bookmark Message
- Subscribe to Message
- Mute Message
- Subscribe to RSS Feed
- Permalink
- Report Inappropriate Content
I create it under /opt/splunkforwarder/etc/apps/gurobi/default/
- Mark as New
- Bookmark Message
- Subscribe to Message
- Mute Message
- Subscribe to RSS Feed
- Permalink
- Report Inappropriate Content
If you're really installing the alert on a Universal Forwarder then you'll never see it because UFs don't have a UI. Are you sure that's location where the edits were made?
If this reply helps you, Karma would be appreciated.
- Mark as New
- Bookmark Message
- Subscribe to Message
- Mute Message
- Subscribe to RSS Feed
- Permalink
- Report Inappropriate Content
yes I am sure
- Mark as New
- Bookmark Message
- Subscribe to Message
- Mute Message
- Subscribe to RSS Feed
- Permalink
- Report Inappropriate Content
same path used for inputs.conf file and I can see logs from that data source in the UI
- Mark as New
- Bookmark Message
- Subscribe to Message
- Mute Message
- Subscribe to RSS Feed
- Permalink
- Report Inappropriate Content
The inputs.conf is for data collection which can happen on both Splunk Universal Forwarder and Splunk enterprise. The alerting (which is basically scheduled searching) happens only on Splunk Enterprise instances, commonly on your Search Heads. Instead of creating the alert on UF, place it on your Search Head (where you're searching the data).
- Mark as New
- Bookmark Message
- Subscribe to Message
- Mute Message
- Subscribe to RSS Feed
- Permalink
- Report Inappropriate Content
Splunk doesn't like "0/1 * * * *" as a cron schedule. Try "* * * * *" to get it working. Then change to a less-frequent schedule.
The config is missing the counttype setting. Without it, the search defaults to a report. To make it an alert, set counttype = number of events.
If this reply helps you, Karma would be appreciated.
- Mark as New
- Bookmark Message
- Subscribe to Message
- Mute Message
- Subscribe to RSS Feed
- Permalink
- Report Inappropriate Content
I am using the following configuration, but still can't see it
[Gurobitest]
# send an email notification
action.email = 1
action.email.to = <my_email_address>
action.email.useNSSubject = 1
alert.suppress = 0
alert.track = 0
cron_schedule = 0 23 * * *
counttype = number of events
quantity = 0
relation = greater than
#search for results in the last day
dispatch.earliest_time = -1d
dispatch.latest_time = now
display.events.fields = ["host","source","sourcetype","latitude"]
display.page.search.mode = verbose
display.visualizations.charting.chart = area
display.visualizations.type = mapping
enableSched = 1
request.ui_dispatch_app = search
request.ui_dispatch_view = search
search = sourcetype=gurobi_expiration


