- Find Answers
- :
- Using Splunk
- :
- Other Using Splunk
- :
- Alerting
- :
- Create a real-time alert that triggers when count ...
- Subscribe to RSS Feed
- Mark Topic as New
- Mark Topic as Read
- Float this Topic for Current User
- Bookmark Topic
- Subscribe to Topic
- Mute Topic
- Printer Friendly Page
- Mark as New
- Bookmark Message
- Subscribe to Message
- Mute Message
- Subscribe to RSS Feed
- Permalink
- Report Inappropriate Content
Use Case:
• Our Jira instance crashes intermittently when there is heavy load on the svr.
• The cause is The JVM Garbage Collection (GC) does not run effectively as server load increases, eventually crashing java. Also the cpu climbs to 390% usage due to JVM struggling and consuming resources.
Splunk Goal:
• To Monitor in real-time and Alert the Admin when splunk sees the GC beginning to struggle so that admin can do graceful restart of jira b/f it crashes.
KPI:
• Search for “Full GC” in logs, if more than 2 hits are found within 1 minute timespan, then JVM is heading out of control and send email alert to admin.
I need your help on:
From my attempts below, I think I am extracting what I need as a Report, but I don't know how to make the alert trigger only when the internal count (which is 5 in two results below ) > 2 and NOT the total event records found of (5+1=6) or (1+5+1=7) of that day.
It seems that the total # of events returned (6 or 7) will always trip the alert, which is not what we want.
Here is my setup:
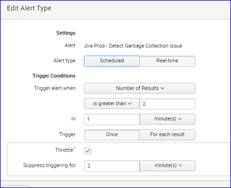
Setup my realtime Alert as:
• Type:
My attempts:
• Query-1 This is to give me a few target dates that have known failures so I can use that data to test with:
index=jira sourcetype=gc host=mdc2vr8223 source="gc-" "[Full GC" | bucket _time span=1m | stats count by _time| eval occurred=if(count>2,"Possible GC issue occurring","GC ok") | table occurred, _time, count
occurred _time count
1 GC ok 2018-01-31 18:00:00 1
... etc...
15 GC ok 2018-02-14 18:55:00 1
16 GC ok 2018-02-15 23:00:00 1
17 Possible GC issue occurring 2018-02-19 07:48:00 5
18 GC ok 2018-02-19 08:08:00 1
19 GC ok 2018-02-21 10:12:00 1
20 Possible GC issue occurring 2018-02-21 10:14:00 5
21 GC ok 2018-02-21 10:28:00 1
22 GC ok 2018-02-25 15:00:00 1
23 GC ok 2018-03-01 03:00:00 1
• Query-2 – To simulate a Real-time trigger, I took Query-1 and ran it against a danger date above:
index=jira sourcetype=gc host=mdc2vr8223 source="gc-" "[Full GC" earliest="02/19/2018:00:00:00" latest="02/19/2018:23:00:00" | bucket _time span=1m | stats count by _time| eval occurred=if(count>2,"Possible GC issue occurring","GC ok") | table occurred, _time, count
occurred _time count
1 Possible GC issue occurring 2018-02-19 07:48:00 5
2 GC ok 2018-02-19 08:08:00 1
What am I missing?
cheers,
Damon
- Mark as New
- Bookmark Message
- Subscribe to Message
- Mute Message
- Subscribe to RSS Feed
- Permalink
- Report Inappropriate Content
If making an alert never let non alert conditions create rows. It's fine for a report not an alert. Instead of "GC ok" use null() and put a | where isnnotnull(occurred) after the stats. Then you should get only rows where the conditions are met.
Also never run "real-time" searches. Run over short intervals. like every 5 minutes.
- Mark as New
- Bookmark Message
- Subscribe to Message
- Mute Message
- Subscribe to RSS Feed
- Permalink
- Report Inappropriate Content
Thank you Starcher! I did everything you mentioned. That did the trick
cheers,
D
- Mark as New
- Bookmark Message
- Subscribe to Message
- Mute Message
- Subscribe to RSS Feed
- Permalink
- Report Inappropriate Content
@damonmanni - we converted starcher's comment to an answer. Please accept the answer so that your question will show as closed.

