Join the Conversation
- Find Answers
- :
- Using Splunk
- :
- Other Using Splunk
- :
- Alerting
- :
- Re: Alert not loading
- Subscribe to RSS Feed
- Mark Topic as New
- Mark Topic as Read
- Float this Topic for Current User
- Bookmark Topic
- Subscribe to Topic
- Mute Topic
- Printer Friendly Page
- Mark as New
- Bookmark Message
- Subscribe to Message
- Mute Message
- Subscribe to RSS Feed
- Permalink
- Report Inappropriate Content
Alert not loading- what does this mean?
I am new to splunk. So I got this message that is attached when I click a link
(|loadjob scheduler__hgt2_c3BsdW5rX2ludGVybmFsX21ldHJpY3M__RMD5c1adf444890fb9a1_at_1645171200_579 | head 1 | tail 1)
|
index=*** sourcetype=***:channel:threats* tag=malware threatInfo.analystVerdict=undefined threatInfo.incidentStatus=unresolved threatInfo.mitigationStatus=mitigated | table _time action dest user signature file_name version description |
|
Saved Search [Detections Handled by SentinelOne]: number of events (1) |
I get the attached message.
Can anyone explain how to resolve this?
- Mark as New
- Bookmark Message
- Subscribe to Message
- Mute Message
- Subscribe to RSS Feed
- Permalink
- Report Inappropriate Content
hi @So76
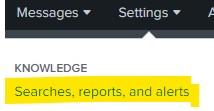
1. Job that you are trying to access , is still available or expired ? you can check for expiry date from searches, reports and alerts, please find following example screenshot
2. do you have required access to view the data for that report/alert , did you able to view it under search reports alerts?
3. alternately you can directly access search results of report/alert by going to search reports alerts
searching the for required alert/report name and click view recent
and click on name to view the result
- Mark as New
- Bookmark Message
- Subscribe to Message
- Mute Message
- Subscribe to RSS Feed
- Permalink
- Report Inappropriate Content
Hey @So76,
You can open the Job inspector and see what exactly is the error and why is the scheduled search results not loading. Open the search.log from the Job Inspector page and search for the "ERROR" keyword. You will be able to identify the reason for not displaying the results.
If you find the answer helpful, an upvote/karma is appreciated
- Mark as New
- Bookmark Message
- Subscribe to Message
- Mute Message
- Subscribe to RSS Feed
- Permalink
- Report Inappropriate Content
Was helpful, will escalate with splunk support to fix it


