
Join the Conversation
- Find Answers
- :
- Using Splunk
- :
- Dashboards & Visualizations
- :
- How to take multiple Key Value pairs and draw a Li...
- Subscribe to RSS Feed
- Mark Topic as New
- Mark Topic as Read
- Float this Topic for Current User
- Bookmark Topic
- Subscribe to Topic
- Mute Topic
- Printer Friendly Page
- Mark as New
- Bookmark Message
- Subscribe to Message
- Mute Message
- Subscribe to RSS Feed
- Permalink
- Report Inappropriate Content

I am trying to draw a line graph with multiple points for each instance of time.
Say I have this:
1. cmdTop1='/usr/sbin/cmd1'; cmdTop2='/usr/libexec/cmd2'; cmdTop3='/usr/java/cmd3'; cpuTop1=1.1; cpuTop2=0.7; cpuTop3=0.2;
2. cmdTop1='/usr/libexec/cmd2'; cmdTop2='/usr/sbin/cmd1'; cmdTop3='/usr/java/cmd3'; cpuTop1=3.2; cpuTop2=1.4; cpuTop3=0.1;
cmdTop* are arbitrary process running paths
cpuTop* are process running cpu usages
The integer corresponds to the rank of each process's cpu usage for that given time and are not related to the other messages.
I would like to have a line graph that shows:
- Y-Axis the cpuTop value
- X-Axis is time
- Each line would correspond to their relative cmdTop* value
What I have so far is I can separate these values into two mv columns with corresponding command and CPU values:
my base search | rex max_match=0 "cmdTop\d+=(?<Command>[^;]+)" | rex max_match=0 "cpuTop\d+=(?<CPU>[^;]+)" | table Command CPU
I can't seem to get any further with this, help would be greatly appreciated!
EDIT: Some additional information.
These lines are not guaranteed to be continuous, or even unique. Multiple commands may have the same command name. Given the following example:
cmdTop1='/usr/java/latest/bin/java -cp foo'; cmdTop2='/usr/java/latest/bin/java -cp foo'; cmdTop3='/usr/java/latest/bin/java -cp foo'; cpuTop1=8.0; cpuTop2=4.0; cpuTop3=2.0;
cmdTop1='/usr/java/latest/bin/java -cp foo'; cmdTop2='/usr/java/latest/bin/java -cp foo'; cmdTop3='/usr/java/latest/bin/java -cp foo'; cpuTop1=16.0; cpuTop2=8.0; cpuTop3=4.0;
It would not be possible to assign a line to an instance of /usr/java/latest/bin/java -cp foo, the graph would have to guess/arbitrarily assign values. This is an edge case that is impossible to solve given the dataset.
- Mark as New
- Bookmark Message
- Subscribe to Message
- Mute Message
- Subscribe to RSS Feed
- Permalink
- Report Inappropriate Content
Ended up going with a kludgey workaround to this answer.
- Evaluate each paring, setting the column to be equal to the current instance's command value
- Set the rows to be the current snapshot of the CPU usage
- Append a suffix string of C1-5 to ensure uniqueness (assuming only 5 entries currently, above examples only have 3
- Pull out the current epoch time from each message, use that for X
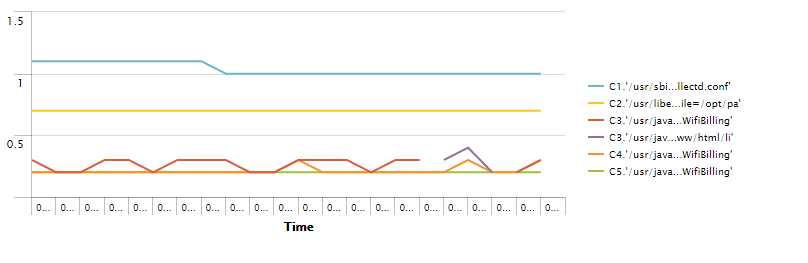
my base search | eval C1.{cmdTop1}=cpuTop1 | eval C2.{cmdTop2}=cpuTop2 | eval C3.{cmdTop3}=cpuTop3 | eval C4.{cmdTop4}=cpuTop4 | eval C5.{cmdTop5}=cpuTop5 | eval Time=strftime(epochtime, "%m/%d/%y %H:%M:%S %Z") | table Time C1* C2* C3* C4* C5*
This gives us something nice like this:
Don't think there's a better way beyond this.

- Mark as New
- Bookmark Message
- Subscribe to Message
- Mute Message
- Subscribe to RSS Feed
- Permalink
- Report Inappropriate Content
Ended up going with a kludgey workaround to this answer.
- Evaluate each paring, setting the column to be equal to the current instance's command value
- Set the rows to be the current snapshot of the CPU usage
- Append a suffix string of C1-5 to ensure uniqueness (assuming only 5 entries currently, above examples only have 3
- Pull out the current epoch time from each message, use that for X
my base search | eval C1.{cmdTop1}=cpuTop1 | eval C2.{cmdTop2}=cpuTop2 | eval C3.{cmdTop3}=cpuTop3 | eval C4.{cmdTop4}=cpuTop4 | eval C5.{cmdTop5}=cpuTop5 | eval Time=strftime(epochtime, "%m/%d/%y %H:%M:%S %Z") | table Time C1* C2* C3* C4* C5*
This gives us something nice like this:
Don't think there's a better way beyond this.

Join the Splunk Community Slack to learn, troubleshoot, and make connections with fellow Splunk practitioners in real time!
Join Splunk User Groups to connect and learn in-person by region or remotely by topic or industry.
Enterprise Security Watch Party: What’s New in 8.8 - Recap
Move CrowdStrike FDR ingestion to Data Inputs with a guided migration
Make Your Machine Data AI-Ready in Splunk
