- Restructure Archive
- :
- User Groups
- :
- Europe, Middle East and Africa
- :
- Vienna User Group
- :
- Blog
- :
- Vienna Splunk Meetup 2021 Q1
Vienna Splunk Meetup 2021 Q1
- Subscribe to RSS Feed
- Mark as New
- Mark as Read
- Bookmark Topic
- Subscribe
- Printer Friendly Page
- Report Inappropriate Content
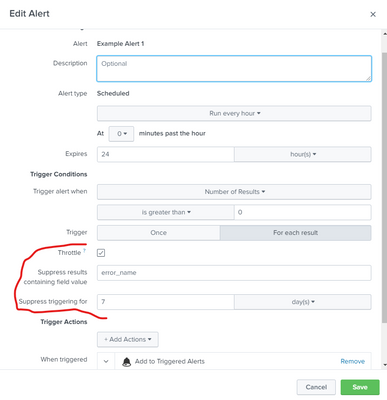
Per Field Throttling
Throttle alert per field from the Alert settings page:
Alert Throttle for 7 days per error_name
| inputlookup alert_lookup_example.csv append=true
| eval now=now(), alerted_time = coalesce(alerted_time, now)
| stats min(alerted_time) as alerted_time, max(now) as now by error_name
| eval throwout_threshhold = now - (3600 * 24 * 7)
| where alerted_time > throwout_threshhold
| outputlookup alert_lookup_example.csv
| where alerted_time = now
Errors seen within last 7 days, but not in last 7-14 days
| makeresults count=100
| streamstats count as day
| eval error_name=case(day = 15, "error0", day = 8, "error1", day = 6, "error2", day % 3 = 0, "error3", day % 2 = 0, "error4")
| eval _time = _time - (day * 3600 * 24)
| where isnotnull(error_name)

| inputlookup alert_lookup_example.csv append=true
| stats min(_time) as _time by error_name
| where _time >= now() - (3600 * 24 * 14)
| outputlookup alert_lookup_example.csv
| where _time >= now() - (3600 * 24 * 7)
Dokumentation:
Time Filter on Lookups
Filter a lookup containing _time with a timepicker
| inputlookup mylookup.csv WHERE [
  | makeresults count=1
  | addinfo
  | eval search="( ( _time >= " . info_min_time . " ) AND ( _time < " . replace(info_max_time, "\+Infinity", "2147483647") . " ) )"
  | table search
]
Dokumentation:
- https://docs.splunk.com/Documentation/Splunk/latest/SearchReference/Inputlookup
- https://docs.splunk.com/Documentation/Splunk/latest/SearchReference/Addinfo
- https://docs.splunk.com/Documentation/Splunk/latest/SearchReference/Makeresults
Fill holes in timecharts
Fill last 14 days with some events to make sure timechart is continuous.
If you need a count, use eval count=1 for real events and count=0 for created events and make sum(count) as count to get real event count.
index=_internal date_wday=tuesday
| eval count=1
| append [
    | gentimes start=-14 end=-1 increment=1d
    | eval _time=starttime, count=0
    | fields _time, count
]
| timechart span=1d sum(count) as count
<base_search>
| timechart span=1d count
| append [
| gentimes start=-14 end=-1 increment=1d
| eval _time=starttime, count=0
| fields _time, count
]
| timechart span=1d sum(count) as count
Dokumentation:
- https://docs.splunk.com/Documentation/Splunk/latest/SearchReference/Gentimes
- https://docs.splunk.com/Documentation/Splunk/latest/SearchReference/Makecontinuous
Peters Sample Dashboard
<too big, see attachments>
Timewrap
Using Timewrap makes the timeline specific to your searchframe
index=_internal group="per_sourcetype_thruput" sourcetype=splunkd earliest="-2d@d" latest="@h"
| timechart span=1h avg(eps)
| timewrap series=exact time_format="%d-%m-%Y" 1d
Using alternative that makes the timeframe to start at 00:00 and end at 23:59
index=_internal group="per_sourcetype_thruput" sourcetype=splunkd earliest="-2d@d" latest="@h"
| bin _time span=1h
| addinfo
| eval date = "avg(eps)_" . strftime(_time,"%d-%m-%Y"), _time = strptime(strftime(info_max_time, "%d-%m-%Y") .  " " . strftime(_time,"%H:%M:%S"), "%d-%m-%Y %H:%M:%S")
| chart avg(eps) over _time by date
Trick how to get the previous result with using timewrap
index=_internal group="per_sourcetype_thruput" sourcetype=splunkd earliest="-2d@d" latest="+1d@d"
| timechart span=1h avg(eps)
| timewrap series=exact time_format="%d-%m-%Y" 1d
Dokumentation:
Reltime
Example Dashboard
<form>
  <label>Reltime</label>
  <search>
    <query>
      | makeresults
      | addinfo
      | eval _time = info_min_time | reltime | rename reltime as reltime1
      | eval _time = info_max_time | reltime | rename reltime as reltime2
    </query>
    <earliest>$time_token.earliest$</earliest>
    <latest>$time_token.latest$</latest>
    <done>
      <set token="reltime1">$result.reltime1$</set>
      <set token="reltime2">$result.reltime2$</set>
    </done>
  </search>
  <fieldset submitButton="false">
    <input type="time" token="time_token">
      <label></label>
      <default>
        <earliest>-7d@h</earliest>
        <latest>now</latest>
      </default>
    </input>
  </fieldset>
  <row>
    <panel>
      <title>Events between $reltime1$ and $reltime2$</title>
      <table>
        <search>
          <query>
            | makeresults
            | addinfo
            | eval _time = info_min_time | reltime | rename reltime as reltime1
            | eval _time = info_max_time | reltime | rename reltime as reltime2
          </query>
          <earliest>$time_token.earliest$</earliest>
          <latest>$time_token.latest$</latest>
        </search>
        <option name="drilldown">none</option>
        <option name="refresh.display">progressbar</option>
      </table>
    </panel>
  </row>
</form>
You must be a registered user to add a comment. If you've already registered, sign in. Otherwise, register and sign in.

