Join the Conversation
- Find Answers
- :
- Using Splunk
- :
- Splunk Search
- :
- Re: timechart with multiple series
- Subscribe to RSS Feed
- Mark Topic as New
- Mark Topic as Read
- Float this Topic for Current User
- Bookmark Topic
- Subscribe to Topic
- Mute Topic
- Printer Friendly Page
- Mark as New
- Bookmark Message
- Subscribe to Message
- Mute Message
- Subscribe to RSS Feed
- Permalink
- Report Inappropriate Content
timechart with multiple series
Hi,
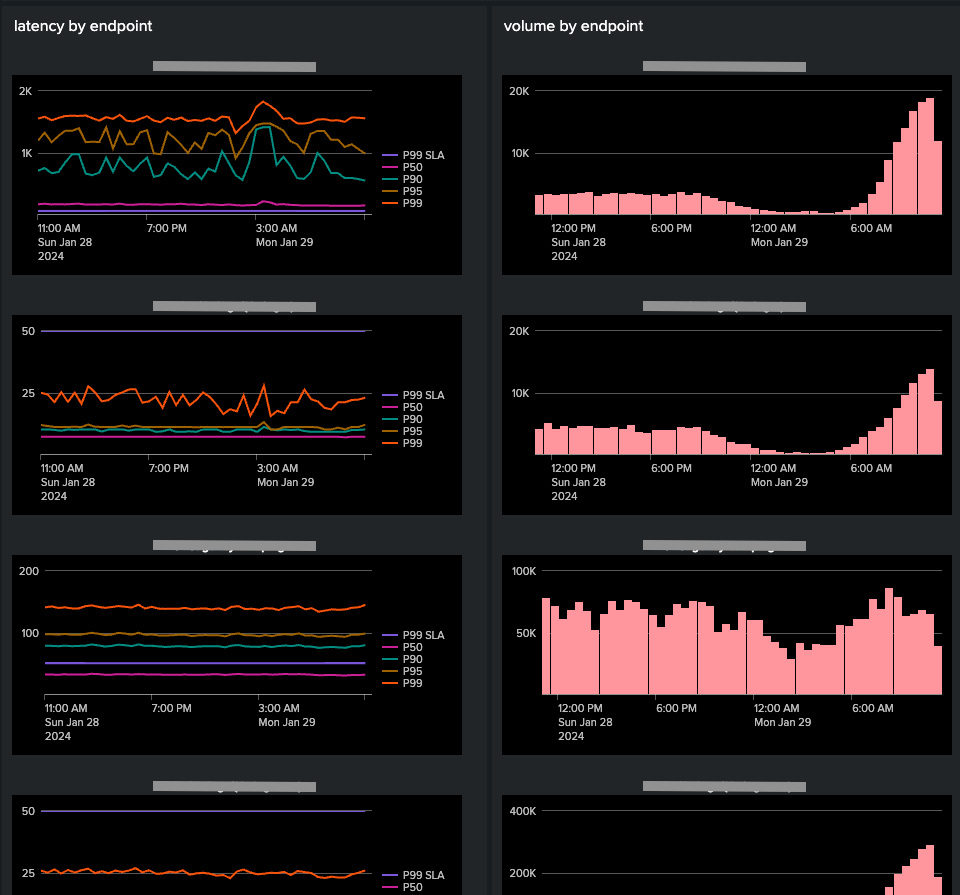
Im trying to create a dashboard that easily presents api endpoint performance metrics
I am generating a summary index using the following search
index=my_index app_name="my_app" sourcetype="aws:ecs" "line.logger"=USAGE_LOG
| fields _time line.uri_path line.execution_time line.status line.clientId
``` use a regex to figure out the endpoint from the uri path```
| lookup endpoint_regex_lookup matchstring as line.uri_path OUTPUT app endpoint match
| rename line.status as http_status, line.clientId as client_id
| fillnull value="" http_status client_id
| bin _time span=1m
| sistats count as volume p50(line.execution_time) as P50 p90(line.execution_time) as P90 p95(line.execution_time) as P95 p99(line.execution_time) as P99 by _time app endpoint http_status client_id
and i can use searches like this
index=summary source=summary-my_app
| timechart $t_span$  p50(line.execution_time) as P50  p90(line.execution_time) as P90  p95(line.execution_time) as P95  p99(line.execution_time) as P99 by endpoint
| sort endpoint

---

index=summary source=summary-my_app
| timechart span=1m  count by endpoint
so i can generate a dashboard using a trellis layout that maps the performance of our endpoints without having to hard-code a bunch of panels.
im trying to add a chart that displays the http_status counts over time for each endpoint (similar to the latency chart).
i know i cant use the following:
index=summary source=summary-my_app
| timechart count by endpoint http_status
so thought the following might work:
index=summary source=summary-my_app
| stats count by endpoint http_status _time
but this shows me the http_status counts on a single line rather than as seperate series.
- Mark as New
- Bookmark Message
- Subscribe to Message
- Mute Message
- Subscribe to RSS Feed
- Permalink
- Report Inappropriate Content
I'm not entirely sure if I understand what you're asking for, but it sounds like this might be resolved by defining more fields? eg:
| eval status_{http_status}=http_status
| timechart count(status_*) as * by endpoint
Would that do the trick?

