Are you a member of the Splunk Community?
- Find Answers
- :
- Using Splunk
- :
- Splunk Search
- :
- Windows Servers - High CPU usuage of process that ...
- Subscribe to RSS Feed
- Mark Topic as New
- Mark Topic as Read
- Float this Topic for Current User
- Bookmark Topic
- Subscribe to Topic
- Mute Topic
- Printer Friendly Page
- Mark as New
- Bookmark Message
- Subscribe to Message
- Mute Message
- Subscribe to RSS Feed
- Permalink
- Report Inappropriate Content
Windows Servers - High CPU usuage of process that is greater than 90
Hi Team,
I wanted to set up alert in Splunk cloud for windows machines when CPU% of a single process is greater than 90.
Please do help how to write the Query
My below query is not working properly as expected.
index="index" host="windows" source="WMI:ProcessesCPU" | WHERE NOT Name="_Total" | WHERE NOT Name="System" | WHERE NOT Name="Idle"| streamstats dc(_time) as distinct_times | head (distinct_times == 1) | stats latest(PercentProcessorTime) as CPU% by Name | sort -ProcessorTime |eval AlertStatus=if('CPU%'> 90, "Alert", "Ignore") |search AlertStatus="Alert"
wmi.conf file configuration:
[WMI:ProcessesCPU]
interval = 60
wql = SELECT Name, PercentProcessorTime, PercentPrivilegedTime, PercentUserTime, ThreadCount FROM Win32_PerfFormattedData_PerfProc_Process WHERE PercentProcessorTime>0
disabled = 0
Total of all CPU processes in the windows machine should be 100% as we see in task manager.
But I'm getting 100 % for each process which is wrong.
Could some one please help
- Mark as New
- Bookmark Message
- Subscribe to Message
- Mute Message
- Subscribe to RSS Feed
- Permalink
- Report Inappropriate Content
Your query has some errors
index="index" host="host" source="WMI:ProcessesCPU"
| WHERE NOT Name="_Total"
| WHERE NOT Name="System"
| WHERE NOT Name="Idle"
| streamstats dc(_time) as distinct_times
| head (distinct_times == 1)
| stats latest(PercentProcessorTime) as CPU% by Name
| sort -ProcessorTime
| eval AlertStatus=if('CPU%'> 90, "Alert", "Ignore")
| search AlertStatus="Alert"
what are you trying to achieve with streamstats/head combination?
Also, you have no field ProcessorTime after your stats command, so the sort does nothing.
Trying to compare, what I imagine is Perfmon data to task manager process CPU will not work as they are not reporting the same data. It looks like you need to check what your field PercentProcessorTime is actually telling you.
- Mark as New
- Bookmark Message
- Subscribe to Message
- Mute Message
- Subscribe to RSS Feed
- Permalink
- Report Inappropriate Content
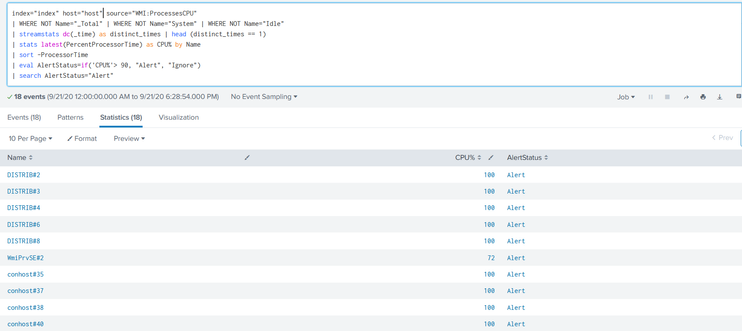
Could you please help us with the above Question for which we are not getting expected output.
The below is the Query we used:
index="index" host="host" source="WMI:ProcessesCPU" | WHERE NOT Name="_Total" | WHERE NOT Name="System" | WHERE NOT Name="Idle" | streamstats dc(_time) as distinct_times | head (distinct_times == 1) | stats latest(PercentProcessorTime) as CPU% by Name | sort -ProcessorTime |eval AlertStatus=if('CPU%'> 90, "Alert", "Ignore") |search AlertStatus="Alert"
The output we received is in the above screenshot.

