
Join the Conversation
- Find Answers
- :
- Using Splunk
- :
- Splunk Search
- :
- Why my transaction command takes wrong event
- Subscribe to RSS Feed
- Mark Topic as New
- Mark Topic as Read
- Float this Topic for Current User
- Bookmark Topic
- Subscribe to Topic
- Mute Topic
- Printer Friendly Page
- Mark as New
- Bookmark Message
- Subscribe to Message
- Mute Message
- Subscribe to RSS Feed
- Permalink
- Report Inappropriate Content
Why my transaction command takes wrong event

I am trying to determine the outage duration of a network device . I use the transaction command for this. My device goes down and comes back live say for every other hour. But my transaction command is only considering the first downtime as START and last uptime as END, due to this I am not able to determine the actual outage hours . Is there a way to make my transaction command understand how to calculate by checking every downtime and uptime events.
Example: My device goes down at 1am and comes live at 2am. Again goes down at 3am and comes live at 4am.
My transaction command calculates the downtime as 1am and uptime as 4am.
So the actual total outage hours is 2hrs (1am-2am and 3am-4am) but my transaction command calculates it as 3hrs (1am-4am).
my command is | transaction host startswith=(devicestatus="Down") endswith=(devicestatus="Up") maxspan=7d
Thanks in advance..
- Mark as New
- Bookmark Message
- Subscribe to Message
- Mute Message
- Subscribe to RSS Feed
- Permalink
- Report Inappropriate Content
Try mvexpand that is well explained in the below link:
https://answers.splunk.com/answers/37766/transaction-with-mvexpand.html
- Mark as New
- Bookmark Message
- Subscribe to Message
- Mute Message
- Subscribe to RSS Feed
- Permalink
- Report Inappropriate Content


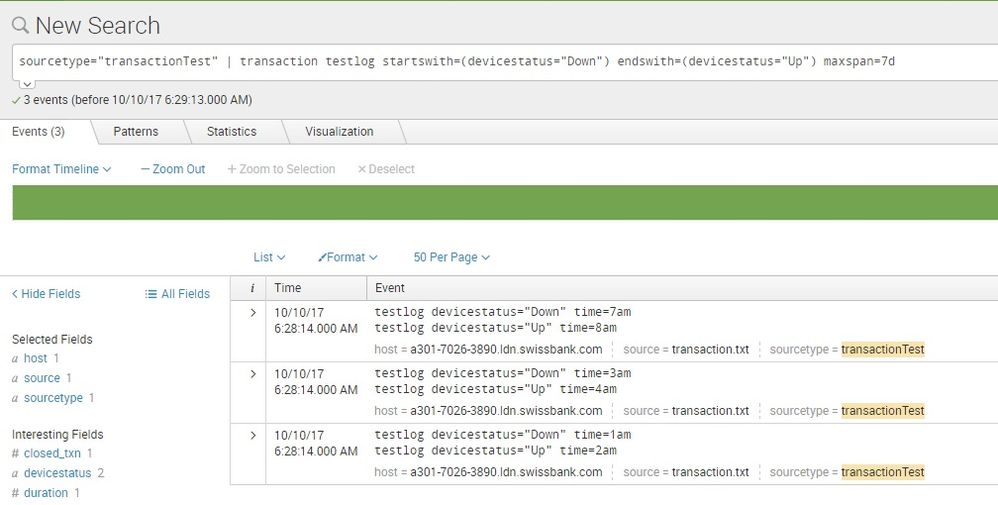
i uploaded these sample events -
testlog devicestatus="Down" time=1am
testlog devicestatus="Up" time=2am
testlog devicestatus="Down" time=3am
testlog devicestatus="Up" time=4am
testlog devicestatus="Down" time=7am
testlog devicestatus="Up" time=8am
and transaction seems working fine..
how you calculate the outage hours.. please write the full command and maybe, post some sample events..



Join the Splunk Community Slack to learn, troubleshoot, and make connections with fellow Splunk practitioners in real time!
Join Splunk User Groups to connect and learn in-person by region or remotely by topic or industry.
SOC4Kafka - New Kafka Connector Powered by OpenTelemetry
Rounding off the Splunk Dashboard Contest
A Four Part Event Series: AI + Observability: AI Agents, LLMs, Apps, & Infrastructure
