- Find Answers
- :
- Using Splunk
- :
- Splunk Search
- :
- Why is the Time picker not working on search/dashb...
- Subscribe to RSS Feed
- Mark Topic as New
- Mark Topic as Read
- Float this Topic for Current User
- Bookmark Topic
- Subscribe to Topic
- Mute Topic
- Printer Friendly Page
- Mark as New
- Bookmark Message
- Subscribe to Message
- Mute Message
- Subscribe to RSS Feed
- Permalink
- Report Inappropriate Content
Hi.
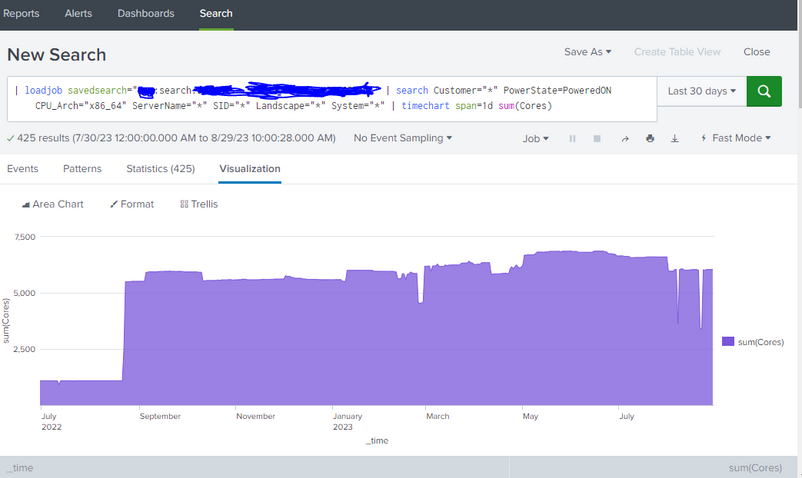
i have a search a show a graphchart for 14 months. If i change the timepicker it still shows 14 months for some reason. As you can see in the picture, the time picker says 30 days, but the graph still shows 14 months. What gives?
Also, is there a way to display a trendline on the graph? If i use the | trendline sma10(Cores) or the like, it changes the graph instead of just showing a linear line
- Mark as New
- Bookmark Message
- Subscribe to Message
- Mute Message
- Subscribe to RSS Feed
- Permalink
- Report Inappropriate Content
Hi @michaelnorup,
using loadjob, you display the results of an already executed search, so the Time Picker hasn't any effect on it, you can use the Time Picker on searches, not on loadjob.
Ciao.
Giuseppe
- Mark as New
- Bookmark Message
- Subscribe to Message
- Mute Message
- Subscribe to RSS Feed
- Permalink
- Report Inappropriate Content
Hi Giuseppe.
Thanks makes sense, thanks alot.
Do you have any idea about the trendline then? 🙂
- Mark as New
- Bookmark Message
- Subscribe to Message
- Mute Message
- Subscribe to RSS Feed
- Permalink
- Report Inappropriate Content
Hi @michaelnorup,
about the trendline, if you havedata to create the trendline in the results of the loadjob , you could elaborate them.
I cannot see tem because, after a timechart you don't have other fields, see, removing the timeachart, which fields you have, so you could modify your search.
If you would help, please share your search in text mode (using the Insert/Edit Code Sample button), not as a screenshot, eventually with a masked part, to avoid to re-write all the search.
Ciao.
Giuseppe
- Mark as New
- Bookmark Message
- Subscribe to Message
- Mute Message
- Subscribe to RSS Feed
- Permalink
- Report Inappropriate Content
Hi
This is the loadjob:
| savedsearch "Server - XXXXXX" | fillnull value=- | search SerialNumber!=VMware* | eval ServerName = host | eval ServerName = upper(ServerName) | eval Virtual="N/A" | eval PowerState="PoweredOn" | append [| savedsearch "Server - Vmware info" | eval CPU_Arch = "x86_64" | eval Cores = CpuCount | eval DiskGB = ProvisionedSpaceGB | eval Virtual="VMware"] | table _time Date Customer ServerName Cores MemoryGB DiskGB CPU_Arch PowerState Virtual Landscape SID System Instance | fillnull value=- | eval Date=strftime(_time, "%x") | dedup ServerName,DateCan you use that? ^^
Thanks
- Mark as New
- Bookmark Message
- Subscribe to Message
- Mute Message
- Subscribe to RSS Feed
- Permalink
- Report Inappropriate Content
Hi @michaelnorup,
sorry I forgot the main question: which trend do you want to display?
In other words, with the previous search you have the used number of cores, what do you want to add to the graph?
Ciao.
Giuseppe
- Mark as New
- Bookmark Message
- Subscribe to Message
- Mute Message
- Subscribe to RSS Feed
- Permalink
- Report Inappropriate Content
Would love to add a trend line for the amount of cores. So its easier to see if its trending up or down (And maybe even a forecast?)

