Turn on suggestions
Auto-suggest helps you quickly narrow down your search results by suggesting possible matches as you type.
Splunk Search
×
Are you a member of the Splunk Community?
Sign in or Register with your Splunk account to get your questions answered, access valuable resources and connect with experts!
Turn on suggestions
Auto-suggest helps you quickly narrow down your search results by suggesting possible matches as you type.
- Find Answers
- :
- Using Splunk
- :
- Splunk Search
- :
- Why is my time search not showing expected results...
Options
- Subscribe to RSS Feed
- Mark Topic as New
- Mark Topic as Read
- Float this Topic for Current User
- Bookmark Topic
- Subscribe to Topic
- Mute Topic
- Printer Friendly Page
- Mark as New
- Bookmark Message
- Subscribe to Message
- Mute Message
- Subscribe to RSS Feed
- Permalink
- Report Inappropriate Content
Why is my time search not showing expected results with a relative time picker input?
idab
Path Finder
09-08-2015
08:43 AM
Hello everyone,
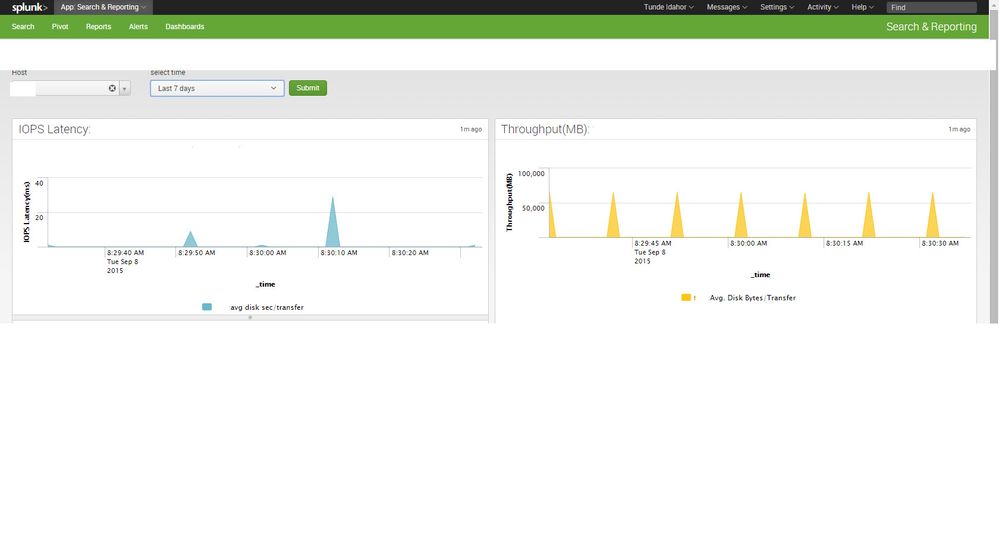
Need your help. I have this dashboard to display some counter information for each host over a certain period of time - using the search tab called "select time", but when I start a search to show the information over the past 24hours or 7days - (Relative), the output on the graph is not well defined as shown on the snapshot below:
This is my search criteria :
index=perfmon counter="Avg. Disk sec/Transfer" Host="*" collection=LogicalDisk earliest=-1m [search index=perfmon counter="Avg. Disk sec/Transfer" host=$host$ collection=LogicalDisk earliest=-1m | stats max(Value) as latency by host | sort 10 -Value | fields host ] | eval dataValue= "avg disk sec/transfer:" + tostring(round(Value,3)*1000) | makemv delim="," allowempty=true dataValue | mvexpand dataValue | eval part=split(dataValue,":") | eval category = Host + ":" + mvindex(part,0) | eval dataPoint = tonumber(mvindex(part,1)) | timechart span=1s latest(dataPoint) by category
Is there a way to resolve this?
- Mark as New
- Bookmark Message
- Subscribe to Message
- Mute Message
- Subscribe to RSS Feed
- Permalink
- Report Inappropriate Content
diogofgm

SplunkTrust
09-08-2015
09:04 AM
Remove earliest=-1m from your search. This is forcing the time over what you choose in the drop down list.
------------
Hope I was able to help you. If so, some karma would be appreciated.
Hope I was able to help you. If so, some karma would be appreciated.
Get Updates on the Splunk Community!
Splunk Enterprise Security(ES) 7.3 is approaching the end of support. Get ready for ...
Hi friends!
At Splunk, your product success is our top priority. With Enterprise Security (ES), we're here ...
Splunk Enterprise Security 8.x: The Essential Upgrade for Threat Detection, ...
Watch On Demand the Tech Talk, and empower your SOC to reach new heights!
Duration: 1 hour
Prepare to ...
Splunk Observability for AI
Don’t miss out on an exciting Tech Talk on Splunk Observability for AI!Discover how Splunk’s agentic AI ...

