Join the Conversation
- Find Answers
- :
- Using Splunk
- :
- Splunk Search
- :
- Why do transforming commands not work after upgrad...
- Subscribe to RSS Feed
- Mark Topic as New
- Mark Topic as Read
- Float this Topic for Current User
- Bookmark Topic
- Subscribe to Topic
- Mute Topic
- Printer Friendly Page
- Mark as New
- Bookmark Message
- Subscribe to Message
- Mute Message
- Subscribe to RSS Feed
- Permalink
- Report Inappropriate Content
Why do transforming commands not work after upgrade to Splunk 8?
Hello,
I have recently upgraded from Splunk 7 to Splunk 8.2.4.
After the upgrade, I noticed that some transform commands such as chart or stats do not work in smart and fast mode.
For instance:
index=main | chart count by host
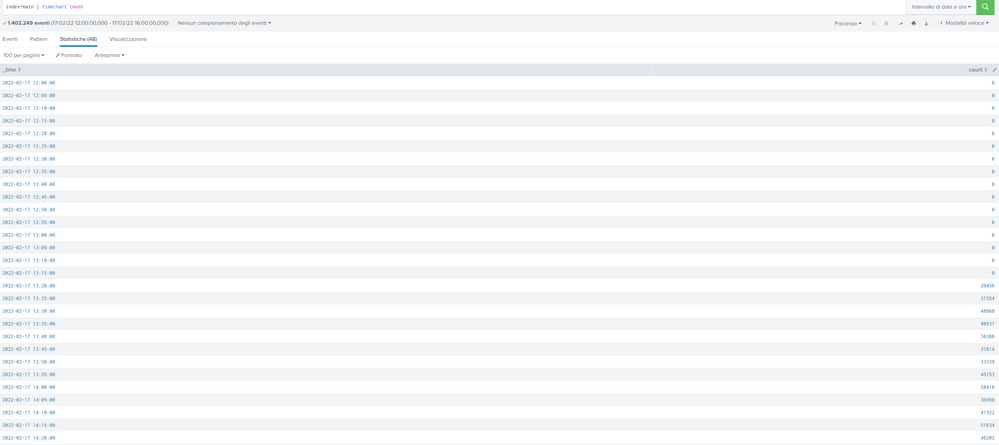
returns the expected results in detailed mode. It returns 0 results in smart and fast mode.
Ps:
The transaction command still works, but I have to select the fields I want with fields in place of table. In Splunk 7 table works too.
I would like that stats and chart commands still work in fast search mode, as it happened in Splunk 7. Could you help me to revert the Splunk 7 working mode?
Thank you very much
Kind Regards
Marco
- Mark as New
- Bookmark Message
- Subscribe to Message
- Mute Message
- Subscribe to RSS Feed
- Permalink
- Report Inappropriate Content
Hi
probably something related your other configurations / your environment as this works ok in my environment.
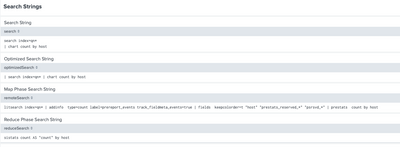
When you you have run this what you found from Job inspector's search.log or Job Details Dashboard (easier to read)?
I got e.g.
r. Ismo
- Mark as New
- Bookmark Message
- Subscribe to Message
- Mute Message
- Subscribe to RSS Feed
- Permalink
- Report Inappropriate Content
Hello,
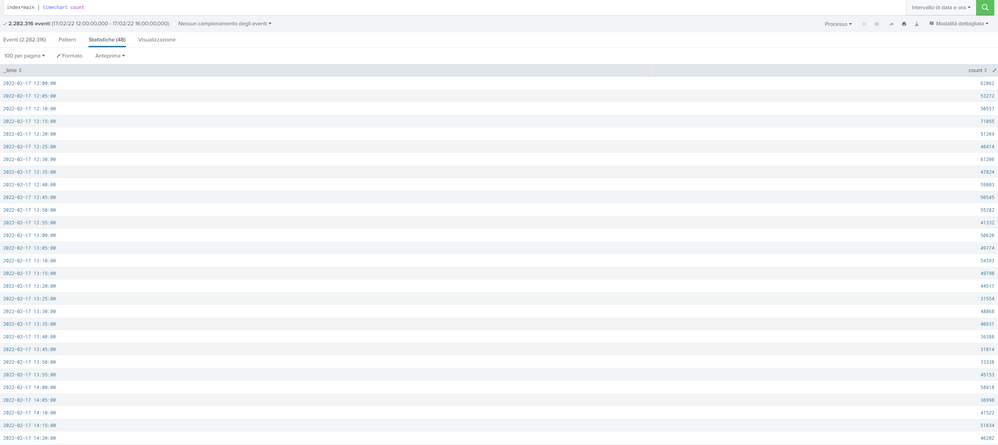
thank you for the interesting. It's not easy to debug, because I found it happens only sometime. I can see this with timechart in place of chart. See here:


I can't understand why.
The search log doesn't show errors:
| normalizedSearch | litsearch index=main | addinfo type=count label=prereport_events | fields keepcolorder=t "_time" "prestats_reserved_*" "psrsvd_*" | prebin _time span=rtspan | prestats count by _time |
| numPreviews | 8 |
| optimizedSearch | | search index=main | timechart count |
| phase0 | litsearch index=main | addinfo type=count label=prereport_events track_fieldmeta_events=true | fields keepcolorder=t "_time" "prestats_reserved_*" "psrsvd_*" | prebin _time span=rtspan | prestats count by _time |
| phase1 | timechart count |
| pid | 674509 |
| priority | 5 |
| provenance | UI:Search |
| reduceSearch | bin _time span=rtspan | sistats count AS "count" by _time |
| remoteSearch | litsearch index=main | addinfo type=count label=prereport_events track_fieldmeta_events=true | fields keepcolorder=t "_time" "prestats_reserved_*" "psrsvd_*" | prebin _time span=rtspan | prestats count by _time |
| reportSearch | timechart count |
Thank you very much
Kind Regards
Marco
- Mark as New
- Bookmark Message
- Subscribe to Message
- Mute Message
- Subscribe to RSS Feed
- Permalink
- Report Inappropriate Content
This is quite interesting 😞
How about if you are adding
index=main host=*
| chart count by host
```or timechart ...```
This should found all events where host is defined (which should be true for all events).
Is this issue only in main and some special sourcetype or for all indexes and source types?
Maybe it's time for splunk support to find if this is bug or some configuration issue?
r. Ismo
- Mark as New
- Bookmark Message
- Subscribe to Message
- Mute Message
- Subscribe to RSS Feed
- Permalink
- Report Inappropriate Content
Oh yes, I tried the by-clause. It's the same: your search
index=main host=*
| timechart count by host
reports results by hosts until 13:20 only in "fast" mode.
Yes, I tried other analogue searches changing index and sourcetype: it's the same for all them.
Thank you very much
Kind Regards
Marco
- Mark as New
- Bookmark Message
- Subscribe to Message
- Mute Message
- Subscribe to RSS Feed
- Permalink
- Report Inappropriate Content
How about changing host to e.g. source? Did it work then or not?
Just try to wondering if issue is your host definition (if you have any props/transforms which override default host definition).
Are you sure that there is ingested events or could there be some delays?
- Mark as New
- Bookmark Message
- Subscribe to Message
- Mute Message
- Subscribe to RSS Feed
- Permalink
- Report Inappropriate Content
Hello,
yes, if I count by source the statistics stop at 13:20 too.
There are events, of course, because if I search in detailed mode I see the full statistics.
I can try to ask for the official support... I can't understand how to debug... The search log doesn't show me errors or timeouts...
Thank you
Marco
- Mark as New
- Bookmark Message
- Subscribe to Message
- Mute Message
- Subscribe to RSS Feed
- Permalink
- Report Inappropriate Content
- Mark as New
- Bookmark Message
- Subscribe to Message
- Mute Message
- Subscribe to RSS Feed
- Permalink
- Report Inappropriate Content
Hello,
just for info, finally with official support help I have found a solution.
My problem was the know issue SPL-212284. I have to set
batch_search_max_pipeline = 1
or
allow_batch_mode = 0
otherwise fast search doesn't work at all.
And if I don't set
batch_search_max_pipeline = 1
even if allow_batch_mode = 0 mstats will randomly fail.
I was trying to improve Splunk performance, so I modified batch_search_max_pipeline from its default value. This was a big mistake. Never change batch_search_max_pipeline, at this moment, at this current Splunk release (8.2.6).
Thank you
Kind Regards
Marco
- Mark as New
- Bookmark Message
- Subscribe to Message
- Mute Message
- Subscribe to RSS Feed
- Permalink
- Report Inappropriate Content
This is a few months old, but I can also confirm that we had modified limits.conf:
[search]
batch_search_max_pipeline = ...
per Splunk optimization documentation. Just increasing this from 1 to 2 caused the issues we were seeing in different ways:
Modifying this setting back to the default "1" (or just commenting out our local/limits.conf stanza line in our case) fixed everything - tstats and Fast vs. Verbose inconsistencies for queries with transforming commands!
Begs the question - why have the optimization setting available in the first place without listing potential side effects?
- Mark as New
- Bookmark Message
- Subscribe to Message
- Mute Message
- Subscribe to RSS Feed
- Permalink
- Report Inappropriate Content
Ryan, Thank you for bringing this forward and I will work to get your input to the Dev team. Vanessa
- Mark as New
- Bookmark Message
- Subscribe to Message
- Mute Message
- Subscribe to RSS Feed
- Permalink
- Report Inappropriate Content
- Mark as New
- Bookmark Message
- Subscribe to Message
- Mute Message
- Subscribe to RSS Feed
- Permalink
- Report Inappropriate Content
Hi @sistemistiposta,
I have Splunk 8.2.4 and commands as chart or stats run with the host field.
Are you meaning that you haven't results in the Events tab or that you haven't resuls in Events and in Statistics tab?
Obviously being chart a streaming command I have results in the Statistics Tab in all the modes (Fast. Smart and Verbose) but I have events only in Verbose in Events Tab.
Ciao.
Giuseppe
- Mark as New
- Bookmark Message
- Subscribe to Message
- Mute Message
- Subscribe to RSS Feed
- Permalink
- Report Inappropriate Content
Ciao Giuseppe,
thank you for the reply. Yes I know that chart or stats commands hide events in fast or smart mode. It's not here the problem.
Thank you
Kind Regards
Marco
- Mark as New
- Bookmark Message
- Subscribe to Message
- Mute Message
- Subscribe to RSS Feed
- Permalink
- Report Inappropriate Content
Hi @sistemistiposta,
tel me if I can help you more, or, please accept an answer for the other people of Community.
good for you, see next time!
Ciao and happy splunking
Giuseppe
P.S.: Karma Points are appreciated 😉
- Mark as New
- Bookmark Message
- Subscribe to Message
- Mute Message
- Subscribe to RSS Feed
- Permalink
- Report Inappropriate Content
I'm curious if you have a resolution yet?
I recently came across a different, but similar issue and it was resolved when I added "| dedup _raw" to my code. I am still uncertain why it made a difference though.
Failed:
index=myindex eventName=myevent hostName=myhostname
| timechart limit=0 span=1h avg(value) as value by eventType
| table...
Success:
index=myindex eventName=myevent hostName=myhostname
| dedup _raw
| timechart limit=0 span=1h avg(value) as value by eventType
| table...
- Mark as New
- Bookmark Message
- Subscribe to Message
- Mute Message
- Subscribe to RSS Feed
- Permalink
- Report Inappropriate Content
Hello @landster,
yes, If I add "| dedup _raw" it works!
but I suspect this could be a kind of trick in order to make the search as verbose.
It's like you add "| fields *" in fast mode. You really perform a smart search.
Adding
| dedup _rawto all my search unfortunately is not a solution for me... and sometimes I could have expected duplicated events (such as when I use mvcombine). I haven't found a solution yet.
This doesn't happen (or I haven't never noticed) in Splunk 7.x.
Thank you for all the hints.
Marco
- Mark as New
- Bookmark Message
- Subscribe to Message
- Mute Message
- Subscribe to RSS Feed
- Permalink
- Report Inappropriate Content
Hello @sistemistiposta,
It is not a permanent solution for me either, and I have a support ticket opened with Splunk. I will let you know what i find out. I was mainly curious if we were experiencing the same problem.
- Mark as New
- Bookmark Message
- Subscribe to Message
- Mute Message
- Subscribe to RSS Feed
- Permalink
- Report Inappropriate Content
Hello @landster and all community,
I noticed that also verbose searches can't work, if they contain a subsearch with transforming commands.
Ie:
[ search host=alice* | stats count by host | fields host ] ...could not work. Instead
[ search host=alice* | dedup host | fields host ] ...always works.
Just a question. Maybe it is not relevant. Do you have already upgraded the kvstore to wiredTiger?
This change and the upgrade to Splunk 8.2.5 are my only upgrade which I have done recently.
I'm still waiting news from Splunk support.
Thank you
Marco
- Mark as New
- Bookmark Message
- Subscribe to Message
- Mute Message
- Subscribe to RSS Feed
- Permalink
- Report Inappropriate Content
We upgraded the storage engine on both our test instance and our production instance, along with the update to 8.2.5. Only the production environment is exhibiting the symptom, however.
- Mark as New
- Bookmark Message
- Subscribe to Message
- Mute Message
- Subscribe to RSS Feed
- Permalink
- Report Inappropriate Content
@landster , the same for me.
In our test environment I didn't notice the problem.
In production we have a large amount of data, so I could suspect that also the data volume can affect this issue.
At this point I hope for news from support...
Kind Regards
Marco

