Turn on suggestions
Auto-suggest helps you quickly narrow down your search results by suggesting possible matches as you type.
Showing results for
Splunk Search
Turn on suggestions
Auto-suggest helps you quickly narrow down your search results by suggesting possible matches as you type.
Showing results for
- Find Answers
- :
- Using Splunk
- :
- Splunk Search
- :
- Why are small searches taking incredibly long?!
Options
- Subscribe to RSS Feed
- Mark Topic as New
- Mark Topic as Read
- Float this Topic for Current User
- Bookmark Topic
- Subscribe to Topic
- Mute Topic
- Printer Friendly Page
- Mark as New
- Bookmark Message
- Subscribe to Message
- Mute Message
- Subscribe to RSS Feed
- Permalink
- Report Inappropriate Content
Why are small searches taking incredibly long?!
paimonsoror
Builder
10-12-2016
04:57 AM
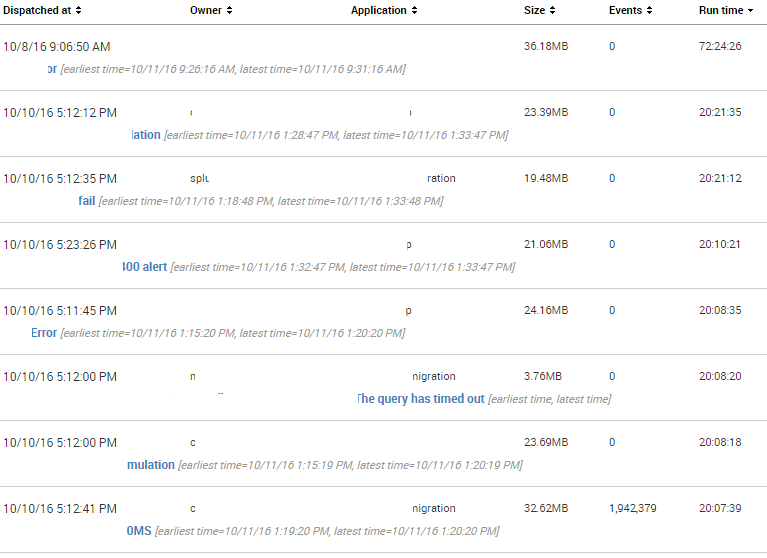
I have been hunting down users in my environment running real-time searches as I thought that they were the root cause, but I have also seen from time to time searches like the ones below lingering around hte Jobs queue. The impact of course is that we start to hit our concurrent search limit
Looking at the logs for these searches, majority of them seem to be stuck in the following loop:
10-11-2016 21:23:18.306 INFO  UnifiedSearch - Processed search targeting arguments
10-11-2016 21:23:18.306 INFO  DispatchThread - Generating results preview took 1 ms
10-11-2016 21:23:23.306 INFO  SearchParser - PARSING: timechart  count
10-11-2016 21:23:23.306 INFO  bucket - Setting info._summary_maxtimespan = 5s
10-11-2016 21:23:23.306 INFO  SearchParser - PARSING: stats count AS query| search query = 10
10-11-2016 21:23:23.306 INFO  StatsProcessor - No group-by fields specified, incompatible for high cardinality improvements
The search that the log above came from is the following:
source="SOME_SOURCE_LOG_FILE" | regex _raw=".Error.|.error.|.Exception.|.exception."|timechart count
- Mark as New
- Bookmark Message
- Subscribe to Message
- Mute Message
- Subscribe to RSS Feed
- Permalink
- Report Inappropriate Content
woodcock
Esteemed Legend
10-12-2016
08:35 AM
The problem is the regex command. Try this search instead:
source="SOME_SOURCE_LOG_FILE" (*error* OR *exception*) | timechart count
- Mark as New
- Bookmark Message
- Subscribe to Message
- Mute Message
- Subscribe to RSS Feed
- Permalink
- Report Inappropriate Content
paimonsoror
Builder
10-12-2016
09:48 AM
Thanks for this. Would you mind elaborating? Why would the regex cause this?
- Mark as New
- Bookmark Message
- Subscribe to Message
- Mute Message
- Subscribe to RSS Feed
- Permalink
- Report Inappropriate Content
lycollicott
Motivator
10-12-2016
08:09 AM
If you run that search for the last 60 minutes, how many events does it return? How many different hosts do they come from?
Get Updates on the Splunk Community!
Developer Spotlight with Paul Stout
Welcome to our very first developer spotlight release series where we'll feature some awesome Splunk ...
State of Splunk Careers 2024: Maximizing Career Outcomes and the Continued Value of ...
For the past four years, Splunk has partnered with Enterprise Strategy Group to conduct a survey that gauges ...
Data-Driven Success: Splunk & Financial Services
Splunk streamlines the process of extracting insights from large volumes of data. In this fast-paced world, ...

