Join the Conversation
- Find Answers
- :
- Using Splunk
- :
- Splunk Search
- :
- What token can I use in a timechart to pass the 's...
- Subscribe to RSS Feed
- Mark Topic as New
- Mark Topic as Read
- Float this Topic for Current User
- Bookmark Topic
- Subscribe to Topic
- Mute Topic
- Printer Friendly Page
- Mark as New
- Bookmark Message
- Subscribe to Message
- Mute Message
- Subscribe to RSS Feed
- Permalink
- Report Inappropriate Content
I have created a dashboard in simple XML and I am attempting to make a dynamic drilldown leveraging the split by clause, and pass the host name to another view.
I have a search that looks like this:
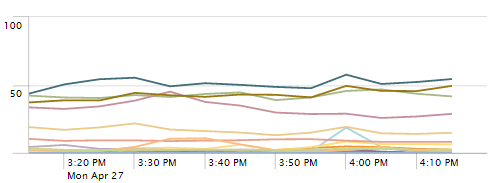
index=os sourcetype=vmstat |eval loadAvg1mi=if(loadAvg1mi > 100,"100",loadAvg1mi)| timechart span=5m avg(loadAvg1mi) AS CPU by hostname limit=0
Which gives me a chart that looks like this:
each line is a host, and I am attempting to drill down from clicking on either the line or the legend, however, there is no token in the documentation to leverage the 'split by' clause in the $foo$ token.
I have tried all of these to no avail:
Token Description
click.name Name of the leftmost field that appears in the table. This is always _time, if present.
click.value Value of the leftmost column in the row.
click.name2 Name of the column.
click.value2 Value of the column.
This last one doesn't work on a timechart, only on tables.
row. < fieldname > All field values for the table row, including those fields that are not displayed.
Does anyone know what token I can use to pass the 'split by' clause (aka host name in my case) to another view?
- Mark as New
- Bookmark Message
- Subscribe to Message
- Mute Message
- Subscribe to RSS Feed
- Permalink
- Report Inappropriate Content
$click.name2$ should be the one you need. I can validate using this simplexml and sourcetype being my splitby (the query itself is nonsense, I'm just testing the splitby will work)-
<dashboard>
  <row>
    <panel>
      <chart>
        <search>
          <query>index=_internal|  timechart  span=5m count AS CPU by sourcetype limit=0</query>
          <earliest>-15m</earliest>
          <latest>now</latest>
        </search>
        <option name="charting.axisLabelsX.majorLabelStyle.overflowMode">ellipsisNone</option>
        <option name="charting.axisLabelsX.majorLabelStyle.rotation">0</option>
        <option name="charting.axisTitleX.visibility">visible</option>
        <option name="charting.axisTitleY.visibility">visible</option>
        <option name="charting.axisTitleY2.visibility">visible</option>
        <option name="charting.axisX.scale">linear</option>
        <option name="charting.axisY.scale">linear</option>
        <option name="charting.axisY2.enabled">false</option>
        <option name="charting.axisY2.scale">inherit</option>
        <option name="charting.chart">line</option>
        <option name="charting.chart.bubbleMaximumSize">50</option>
        <option name="charting.chart.bubbleMinimumSize">10</option>
        <option name="charting.chart.bubbleSizeBy">area</option>
        <option name="charting.chart.nullValueMode">gaps</option>
        <option name="charting.chart.sliceCollapsingThreshold">0.01</option>
        <option name="charting.chart.stackMode">default</option>
        <option name="charting.chart.style">shiny</option>
        <option name="charting.drilldown">all</option>
        <option name="charting.layout.splitSeries">0</option>
        <option name="charting.legend.labelStyle.overflowMode">ellipsisMiddle</option>
        <option name="charting.legend.placement">right</option>
        <option name="drilldown">all</option>

<drilldown>
  <link>
  /app/search/simple_xml_form?form.foo=$click.name2$
  </link>
</drilldown>
         </chart>
    </panel>
  </row>
</dashboard>
Clicking the splunkd_access line
gives me http://localhost:8000/en-US/app/search/simple_xml_form?form.foo=splunkd_access
- Mark as New
- Bookmark Message
- Subscribe to Message
- Mute Message
- Subscribe to RSS Feed
- Permalink
- Report Inappropriate Content
take a look on In page drilldown xml code in splunk dashboard 6...examples.
Or see contextual drilldown elements here:
docs.splunk.com/Documentation/Splunk/6.2.2/Viz/Understandbasictableandchartdrilldownactions
- Mark as New
- Bookmark Message
- Subscribe to Message
- Mute Message
- Subscribe to RSS Feed
- Permalink
- Report Inappropriate Content
I have checked that documentation, as well as the simple XML documentation, and the $foo$ tokens documentation, however the variable I am searching for isn't in any of them, unless I'm completely missing.
They mention columns, and fields, however the click.value, and click.value2 in a chart returns values that are not the split-by clause. Give it a shot and see what you come up with. I ended up with _time and the value, which is the X / Y axis. I got this from the splunk dashboard examples app, and it doesn't mention anything anywhere about a split-by clause variable in a dynamic drill down.
I know there has to be one, but I just don't know what it is.

