Are you a member of the Splunk Community?
- Find Answers
- :
- Using Splunk
- :
- Splunk Search
- :
- Re: Use call stats to calculate concurrent calls.
- Subscribe to RSS Feed
- Mark Topic as New
- Mark Topic as Read
- Float this Topic for Current User
- Bookmark Topic
- Subscribe to Topic
- Mute Topic
- Printer Friendly Page
- Mark as New
- Bookmark Message
- Subscribe to Message
- Mute Message
- Subscribe to RSS Feed
- Permalink
- Report Inappropriate Content
Use call stats to calculate concurrent calls.
I have a data source that provides call records for telephone calls. Each call record contains a call duration and timestamp.
I want to perform the follow calculation and graph it.
If i can determine the number calls per minute "A" and the average call duration (in minutes) "B" . Then A*B is the number of circuits in use (concurrent calls, erlangs)
| Call/min | Avg call Min | Circuits |
| 211.85 | 3.816666667 | 808.5608 |
The following works. But it averaged over the hour so if the call rate is not uniform the result is misleading.
- Mark as New
- Bookmark Message
- Subscribe to Message
- Mute Message
- Subscribe to RSS Feed
- Permalink
- Report Inappropriate Content
You could do something like this to create start and end events for each call, then have a running total of concurrent calls.
| gentimes start=-1 increment=1m
| rename starttime as _time
| fields _time
| eval CallDurationSecs=random()%1000


| eval starttime=_time-CallDurationSecs
| eval times=mvappend(starttime,_time)
| mvexpand times
| eval _time=times
| eval change=if(_time=starttime,1,-1)
| sort _time
| streamstats sum(change) as concurrentcalls- Mark as New
- Bookmark Message
- Subscribe to Message
- Mute Message
- Subscribe to RSS Feed
- Permalink
- Report Inappropriate Content
By calculating start time for each event (one value) before mvexpand, thus creating only two events per original event, you solved my biggest performance killer back then. Thank you, @ITWhisperer!
- Mark as New
- Bookmark Message
- Subscribe to Message
- Mute Message
- Subscribe to RSS Feed
- Permalink
- Report Inappropriate Content
When asking a question, it is best to illustrate sample data (doesn't have to be real), desired output, and trial code if any, all in text. Screenshot is very unhelpful unless it is simple graphs.
Back on topic. Several years ago, I had to solve a slightly more complex concurrency problem, in that in addition to duration, each "event" also has a count. But I can no longer find that answer. Fortunately, I was doing some forensics on my old computer today and found the piece in a dashboard.
Assuming data like the following
| _time | call_id | duration |
| 2021-05-28 21:32:20 | call_1 | 39 |
| 2021-05-28 21:21:33 | call_2 | 12 |
| 2021-05-28 21:15:54 | call_3 | 29 |
| 2021-05-28 21:07:15 | call_4 | 2 |
| 2021-05-28 20:56:56 | call_5 | 15 |
| 2021-05-28 20:44:01 | call_6 | 4 |
| 2021-05-28 20:38:14 | call_7 | 37 |
| 2021-05-28 20:19:03 | call_8 | 6 |
| 2021-05-28 20:16:36 | call_9 | 15 |
| 2021-05-28 20:01:49 | call_10 | 20 |
| ... |
Here, duration is measured in minutes.
The idea is to chop off duration into slices with mvranage(), "convert" those slices into new events with mvexpand, each time-shifted by the slice's offset, then add the events up, like the following:
| eval inc = mvrange(0, duration)
| mvexpand inc
| eval _time = _time - inc * 60
| timechart span=1m sum(eval(1)) as concurrent
Here, I assume that time is stamped at the end of call. If timestamp marks the beginning, time shift should use positive offset. For accuracy, the timechart uses 1m timespan, the same amount as unit of duration.
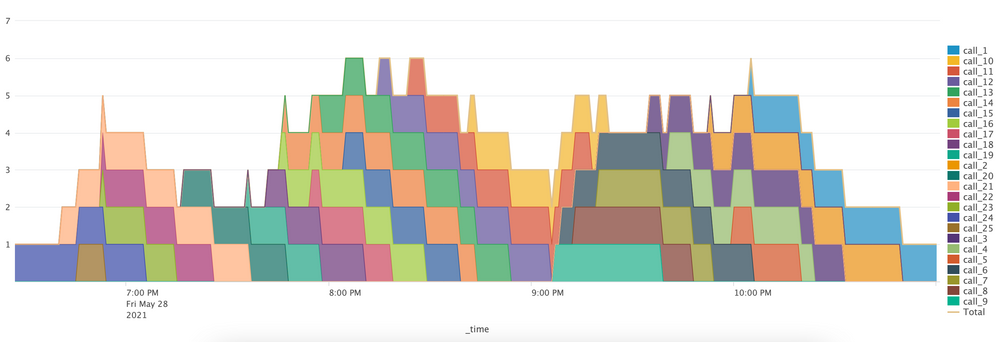
Here is a sample chart: (Total plots the concurrence count.)
It is produced with
| makeresults count=25
| streamstats count
| eval _time = _time - count * 600 + random() % 600, call_id = "call_" . count, duration = random() % 60
| fields - count


| eval inc=mvrange(0, duration)
| mvexpand inc
| eval _time = _time - inc*60
| timechart span=1m limit=30 sum(eval(1)) as concurrent by call_id
| addtotals
The first part simulates randomized sample data. The chart is color striped (with by caller_id) to highlight how call events are sliced up then added together, so addtotals is used to also show totals, and data overlay is used so Total is not mixed into striped area chart. As you are only concerned about total concurrency, there is no need to sum by caller_id.
Hope this helps.
- Mark as New
- Bookmark Message
- Subscribe to Message
- Mute Message
- Subscribe to RSS Feed
- Permalink
- Report Inappropriate Content
For accuracy, the timechart uses 1m timespan, the same amount as unit of duration.
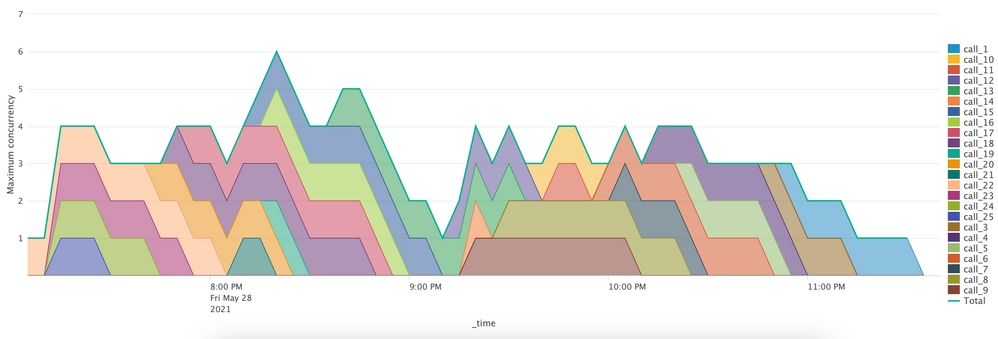
Maximum accuracy may not be all that important in all applications. Splunk's standard charts has a limit on granularity and total timespan. Sometimes, you just want to know what is the maximum concurrency in any given timespan. To calculate this, divide time into bins that equal the unit of duration, then use a dedicated stats command before using timechart to calculate maximum (or average, or any other statistics), like this
| eval inc = mvrange(0, duration)
| mvexpand inc
| eval _time = _time - inc * 60
| bin span=1m  _time
| stats sum(eval(1)) as concurrency by _time call_id
| timechart limit=30 max(concurrency) by call_id
| addtotals
The following plots maximum concurrency in 5-min intervals.


