Join the Conversation
- Find Answers
- :
- Using Splunk
- :
- Splunk Search
- :
- Timechart and auto bin sizing
- Subscribe to RSS Feed
- Mark Topic as New
- Mark Topic as Read
- Float this Topic for Current User
- Bookmark Topic
- Subscribe to Topic
- Mute Topic
- Printer Friendly Page
- Mark as New
- Bookmark Message
- Subscribe to Message
- Mute Message
- Subscribe to RSS Feed
- Permalink
- Report Inappropriate Content
Timechart and auto bin sizing
What I am trying to do is graph / timechart active users. I am starting with this query:
index=anIndex sourcetype=perflogs
| rex field=_raw "^(?:[^,\n]*,){2}(?P<LoginUserID>\w+\.\w+)"
| timechart distinct_count(LoginUserID) partial=false
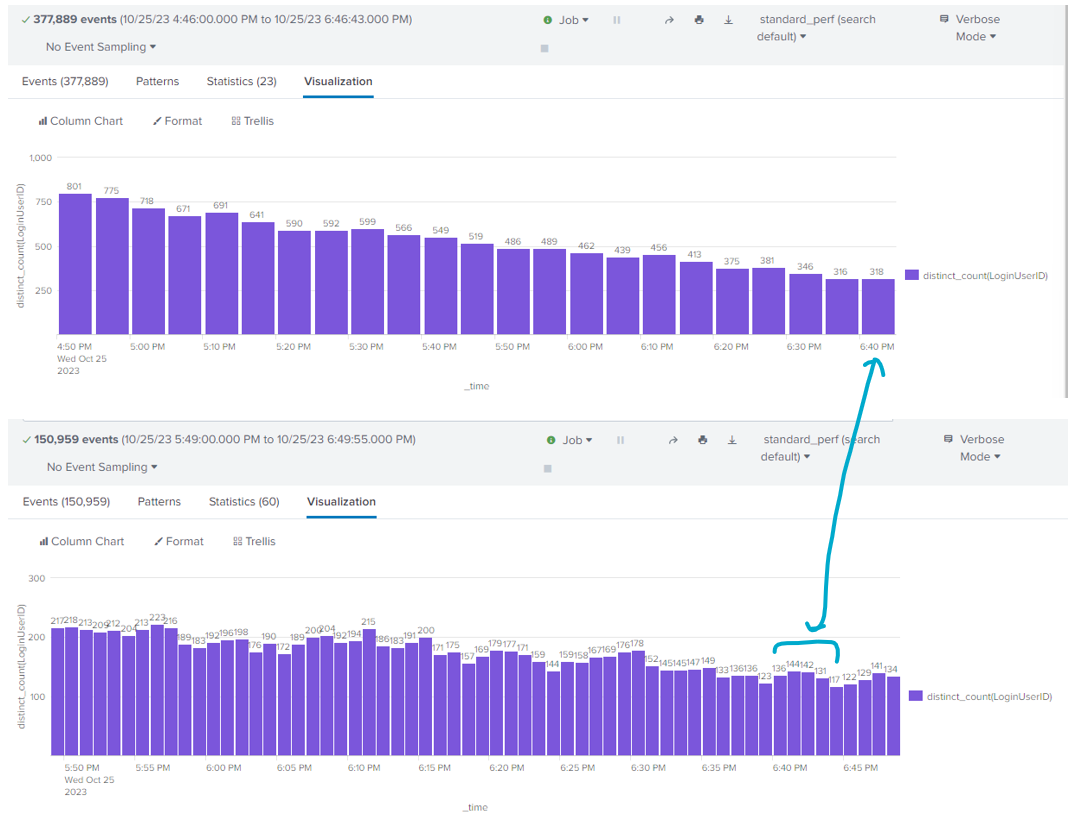
This works and the resulting graph appears to be correct for 120 mins resulting in 5min time buckets.
Then if I shorten the time period down to 60 mins resulting in 1 min buckets then I have a question.
In the 120 min graph with 5 min buckets @ 6:40-6:45 I have 318 Distinct Users but in the 90 min graph with 1 min buckets each 1 min bucket has 136, 144, 142, 131, 117 Distinct Users.
I understand that a user can be active one minute and inactive the next min or two and then active again on the 4th/5th min which is what is happening?
My question is how to get this to show across the one minute bin's users that were active in the previous 5, 1 min buckets resulting in a # that represents users that are logged in and not just active ?
I believe I can add minspan=5min as a kludge but am wondering if there is a way to get this do what im trying to show at the 1min span ?
I believe what I need to do is run two queries the first one as is above, then use an append that will query for events from -5min to -10min.
But, from what I have been trying it either is not working or not doing it correctly.
Basically im trying to find those userID's that are active in the first time bucket (1 min) that were also active in the previous time bucket(s) then do a distinct_count(..) on the usersID's collected from both queries ?
- Mark as New
- Bookmark Message
- Subscribe to Message
- Mute Message
- Subscribe to RSS Feed
- Permalink
- Report Inappropriate Content
Try something like this
| sort 0 _time
| streamstats time_window=5m dc(user) as unique_users
| timechart max(unique_users) as users span=1m- Mark as New
- Bookmark Message
- Subscribe to Message
- Mute Message
- Subscribe to RSS Feed
- Permalink
- Report Inappropriate Content
Im really not sure what this is doing. I incorporated it into my code and was not what I was expecting.
I have also shifted my efforts to using a span=15m for my timechart command due to some other calculations that are on the dashboard I am working on that using a span/bucket smaller than 15 minutes does not represent the data in the way the user(s) are expecting.
So, my next question (I can start a new thread if needed) is that using a span=15m for an hour sample of four 15 min buckets.
But, the buckets are at the 15 min mark of each hour and do not start from when the query is run.
i.e. Buckets = 0-15, 15-30, 30-45, 45-00. Is there an option on timechart to force it to start at the current minute ?
I found in the documentation a reference to <snap-to-time> but dont understand how to use it.

Join the Splunk Community Slack to learn, troubleshoot, and make connections with fellow Splunk practitioners in real time!
Join Splunk User Groups to connect and learn in-person by region or remotely by topic or industry.
ATTENTION: We’re Moving! (AGAIN!)
Deep Dive: Optimizing Telemetry Pipelines in Splunk Observability Cloud
Announcing Modern Navigation: A New Era of Splunk User Experience
