Join the Conversation
- Find Answers
- :
- Using Splunk
- :
- Splunk Search
- :
- Sum Field value with no duplicates and how to time...
- Subscribe to RSS Feed
- Mark Topic as New
- Mark Topic as Read
- Float this Topic for Current User
- Bookmark Topic
- Subscribe to Topic
- Mute Topic
- Printer Friendly Page
- Mark as New
- Bookmark Message
- Subscribe to Message
- Mute Message
- Subscribe to RSS Feed
- Permalink
- Report Inappropriate Content
Sum Field value with no duplicates and how to timechart it.
Hello Team,
I have just started learning Splunk 🙂
Example: I have done basic search index="xyz" |
I have got some logs like below
Event1 : Field Value
username Rakesh
timestamp 10AM
Event 2: Field Value
username Anitha
timestamp 11AM
Event 3: Field Value
username Rakesh
timestamp 12PM
Event 4: Field Value
username Harika
timestamp 1PM
So, I want a total username count 3 (ignoring duplicate Field Rakesh) and I want to display timechart x-axis: timestamp and y-axis: username total count.
- Mark as New
- Bookmark Message
- Subscribe to Message
- Mute Message
- Subscribe to RSS Feed
- Permalink
- Report Inappropriate Content
You can get distinct username by dc() function like
index="xyz" | timechart dc(username) as count
But timechart using _time for plotting time spans. To use timestamp under x axis, it should be date or date time. So can you please share sample data for timestamp ?
KV
- Mark as New
- Bookmark Message
- Subscribe to Message
- Mute Message
- Subscribe to RSS Feed
- Permalink
- Report Inappropriate Content
Hello @kamlesh_vaghela
Thanks for replied,
I can see how many times username is triggered count in time chart, But I want to see field username total count 3(Rakesh, Anitha, Harika) to be plotted in Y-axis, date time is fine on x-axis.
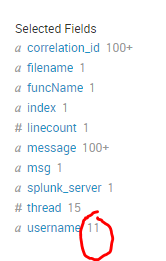
Here username is updated from log all the time, I want to see this total count 11(real time) to be plotted in time chart Y-axis and date time on x-axis.
Thanks in advance for your help.
- Mark as New
- Bookmark Message
- Subscribe to Message
- Mute Message
- Subscribe to RSS Feed
- Permalink
- Report Inappropriate Content
The count in Selected Fields for username is distinct username appeared between selected time range. So when you Weill execute time chart search, will show you all 11 username trends.
Can you please try this?
index="xyz" username=* | timechart useother=f usenull=f count by username
KV
- Mark as New
- Bookmark Message
- Subscribe to Message
- Mute Message
- Subscribe to RSS Feed
- Permalink
- Report Inappropriate Content
Can you. try this?
<your_search_goes_here>
| timechart count by username
---
An upvote would be appreciated and Accept solution if this reply helps!
- Mark as New
- Bookmark Message
- Subscribe to Message
- Mute Message
- Subscribe to RSS Feed
- Permalink
- Report Inappropriate Content


