- Find Answers
- :
- Using Splunk
- :
- Splunk Search
- :
- Splunk dashboard using drilldown showing detailed ...
- Subscribe to RSS Feed
- Mark Topic as New
- Mark Topic as Read
- Float this Topic for Current User
- Bookmark Topic
- Subscribe to Topic
- Mute Topic
- Printer Friendly Page
- Mark as New
- Bookmark Message
- Subscribe to Message
- Mute Message
- Subscribe to RSS Feed
- Permalink
- Report Inappropriate Content
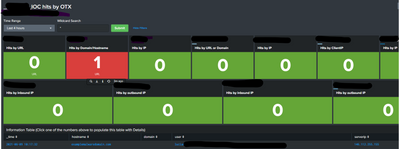
Guys, I've created a dashboard where I hunt IOCs from OTX intelligence across several logs in Splunk.
This dashboard initially was created to show is some IOC was found, and once we click in the number (stats count command) , then the drilldown executes a second query giving us more information (|table command)
However, besides that, I want the dashboard send us an email in case the count >0 every time, then I used sendemail, however, I cant use the sendemail command where the stats count command is because I will receive an email only with the number 😞
so, I thought about using the sendemail in the second query, however, it only will send the email if one of us CLICK in the number , so, I was trying to find a way to turn the drilldown more automatic, which means, once the result >0, automatically the drilldown would be activated without clicking.
I am wonder if this is possible , or if there is other solution that I can use without giving up the design of the dashboard?
Below the dashboard source:
(pay attention to the lookup that I am doing for domain)
<form theme="dark">
<label>_My company_IOC hits by OTX</label>
<description>(proxy, Firewalls, load balancers)</description>
<fieldset submitButton="true">
<input type="time" token="time">
<label>Time Range</label>
<default>
<earliest>-4h@m</earliest>
<latest>now</latest>
</default>
</input>
<input type="text" searchWhenChanged="true" token="wild">
<label>Wildcard Search</label>
<default>*</default>
</input>
</fieldset>
<row>
<panel>
<title>My Tool</title>
<single>
<title>Hits by URL</title>
<search>
<query>index = XXX_XXX_My Tool_proxy_all_01 sourcetype=My Toolnss-web action=Allowed [|inputlookup OTX | search type=URL | rename indicator as url | table url] |dedup user |stats count</query>
<earliest>$time.earliest$</earliest>
<latest>$time.latest$</latest>
<refresh>300s</refresh>
<refreshType>delay</refreshType>
</search>
<option name="colorMode">block</option>
<option name="drilldown">all</option>
<option name="rangeColors">["0x65a637","0xd93f3c"]</option>
<option name="rangeValues">[0]</option>
<option name="refresh.display">progressbar</option>
<option name="underLabel">URL</option>
<option name="useColors">1</option>
<drilldown>
<set token="alert">index = XXX_XXX_My Tool_proxy_all_01 sourcetype=My Toolnss-web action=Allowed [|inputlookup OTX | search type=URL | rename indicator as url | table url] | dedup user | table _time, url, user, src, serverip, ClientIP</set>
</drilldown>
</single>
</panel>
<panel>
<title>My Tool</title>
<single>
<title>Hits by Domain/Hostname</title>
<search>
<query>index = XXX_XXX_My Tool_proxy_all_01 sourcetype=My Toolnss-web action=Allowed [|inputlookup OTX | search type=domain OR type=hostname | rename indicator as hostname | table hostname] |dedup user |stats count</query>
<earliest>$time.earliest$</earliest>
<latest>$time.latest$</latest>
<refresh>200s</refresh>
<refreshType>delay</refreshType>
</search>
<option name="colorMode">block</option>
<option name="drilldown">all</option>
<option name="rangeColors">["0x65a637","0xd93f3c"]</option>
<option name="rangeValues">[0]</option>
<option name="refresh.display">progressbar</option>
<option name="underLabel">URL</option>
<option name="useColors">1</option>
<drilldown>
<set token="alert">index = XXX_XXX_My Tool_proxy_all_01 sourcetype=My Toolnss-web action=Allowed [|inputlookup OTX | search type=domain OR type=hostname | rename indicator as hostname | table hostname] |dedup user | table _time, hostname, domain, user, serverip, ClientIP |sendemail to="myaddress@mydomamin.com" server=smtp.server.co.nz subject="OTX - My Tool Notification - IOC found by Domain" message="This is an test message" sendresults=true inline=true format=csv</set>
</drilldown>
I really appreciate any help or idea. thanks Luciana
- Mark as New
- Bookmark Message
- Subscribe to Message
- Mute Message
- Subscribe to RSS Feed
- Permalink
- Report Inappropriate Content
By setting and unsetting token, you can trigger search to execute it.
Check below example, Here tkn_second_search is set when first search have some count. Please try this XML and let me know if any issue.
<dashboard>
<label>Single Value Test</label>
<search id="first_search">
<query>index = xxx sourcetype=xxx action=Allowed [|inputlookup OTX | search type=URL | rename indicator as url | table url] |dedup user |stats count
</query>
<done>
<condition match="'result.count'!= "0"">
<set token="tkn_second_search">
index = xxx sourcetype=xxx action=Allowed [|inputlookup OTX | search type=domain OR type=hostname | rename indicator as hostname | table hostname]
|dedup user |table _time, hostname, domain, user, serverip, ClientIP |sendemail to="myemail.co.nz" server=smtp.server.co.nz subject="Notification - IOC found by url" message="This is an test message" sendresults=true inline=true format=csv
</set>
</condition>
<condition>
<unset token="tkn_second_search"></unset>
</condition>
</done>
</search>
<row>
<panel>
<html>
Second Search Token = $tkn_second_search$
</html>
</panel>
</row>
<row>
<panel>
<table>
<search>
<query>$tkn_second_search$</query>
<earliest>-24h@h</earliest>
<latest>now</latest>
</search>
<option name="drilldown">none</option>
</table>
</panel>
</row>
</dashboard>
My Sample XML:
<dashboard>
<label>Dependent Search Example</label>
<search id="first_search">
<query>| makeresults | eval count=1 | table count</query>
<done>
<condition match="'result.count'!= "0"">
<set token="tkn_second_search">| makeresults | eval msg="Hello"</set>
</condition>
<condition>
<unset token="tkn_second_search"></unset>
</condition>
</done>
</search>
<row>
<panel>
<html>
Second Search Token = $tkn_second_search$
</html>
</panel>
</row>
<row>
<panel>
<table>
<search>
<query>$tkn_second_search$</query>
<earliest>-24h@h</earliest>
<latest>now</latest>
</search>
<option name="drilldown">none</option>
</table>
</panel>
</row>
</dashboard>
Thanks
KV
▄︻̷̿┻̿═━一
If any of my reply helps you to solve the problem Or gain knowledge, an upvote would be appreciated.
- Mark as New
- Bookmark Message
- Subscribe to Message
- Mute Message
- Subscribe to RSS Feed
- Permalink
- Report Inappropriate Content
@kamlesh_vaghela , I created a new dashboard and copied this new code.
I've created a new dashboard and copied your sample. Is that right?
- Mark as New
- Bookmark Message
- Subscribe to Message
- Mute Message
- Subscribe to RSS Feed
- Permalink
- Report Inappropriate Content
@Luciana Just want to ask Why you are adding No event for this table in condition match?
It should be `<condition match="'result.count'!= "0"">` only instead of ` <condition match="'result.count'!= "0No event for this table"">`
Let me share my full XML..
<form>
<label>Dependent Search Example</label>
<fieldset submitButton="false">
<input type="time" token="time">
<label></label>
<default>
<earliest>-24h@h</earliest>
<latest>now</latest>
</default>
<change>
<unset token="tkn_second_search"></unset>
<unset token="tkn_second_search"></unset>
</change>
</input>
</fieldset>
<row>
<panel>
<single>
<title>Hits by URL</title>
<search id="main_search1">
<query>index = xxx sourcetype=xxxx action=Allowed [|inputlookup OTX | search type=URL | rename indicator as url | table url] |dedup user |stats count</query>
<earliest>$time.earliest$</earliest>
<latest>$time.latest$</latest>
<done>
<condition match="'result.count'!= "0"">
<set token="tkn_second_search">index = xxx sourcetype=xxxx action=Allowed [|inputlookup OTX | search type=URL | rename indicator as url | table url] |dedup user | table _time, url, user, serverip, ClientIP |sendemail to="luciana.campos@Company.co.nz" server=smtp.Company.co.nz subject="OTX XXX Notification - IOC found by Domain" message="This is an test message" sendresults=true inline=true format=csv</set>
</condition>
<condition>
<unset token="tkn_first_search"></unset>
</condition>
</done>
</search>
<option name="drilldown">none</option>
</single>
</panel>
<panel>
<single>
<title>Hits by Domain_Hostname</title>
<search id="main_search2">
<query>index = xxx sourcetype=xxxx action=Allowed [|inputlookup OTX | search type=domain OR type=hostname | rename indicator as hostname | table hostname] |dedup user |stats count</query>
<earliest>$time.earliest$</earliest>
<latest>$time.latest$</latest>
<done>
<condition match="'result.count'!= "0"">
<set token="tkn_second_search"> index = xxx sourcetype=xxxx action=Allowed [|inputlookup OTX | search type=domain OR type=hostname | rename indicator as hostname | table hostname] |dedup user |table _time, hostname, domain, user, serverip, ClientIP |sendemail to="luciana.campos@Company.co.nz" server=smtp.Company.co.nz subject="OTX - XXX Notification - IOC found by Domain" message="This is an test message" sendresults=true inline=true format=csv</set>
</condition>
<condition>
<unset token="tkn_second_search"></unset>
</condition>
</done>
</search>
<option name="drilldown">none</option>
</single>
</panel>
</row>
<row>
<panel>
<table depends="$tkn_first_search$">
<search>
<query>$tkn_first_search$</query>
<earliest>$time.earliest$</earliest>
<latest>$time.latest$</latest>
</search>
<option name="drilldown">none</option>
<option name="refresh.display">progressbar</option>
</table>
</panel>
<panel>
<table depends="$tkn_second_search$">
<search>
<query>$tkn_second_search$</query>
<earliest>$time.earliest$</earliest>
<latest>$time.latest$</latest>
</search>
<option name="drilldown">none</option>
<option name="refresh.display">progressbar</option>
</table>
</panel>
</row>
</form>
- Mark as New
- Bookmark Message
- Subscribe to Message
- Mute Message
- Subscribe to RSS Feed
- Permalink
- Report Inappropriate Content
@kamlesh_vaghela I want to thank you for all your help. you were right, it was the condition "<condition match="'result.count'!= "0No event for this table"">"
It worked when I've changed the condition back as your suggestion and then, I've hidden all dashboards with the second search WHEN there are no results.
Thanks again. I really appreciate it.
- Mark as New
- Bookmark Message
- Subscribe to Message
- Mute Message
- Subscribe to RSS Feed
- Permalink
- Report Inappropriate Content
Glad to help you @Luciana . I hope you learn with this trail and error exercise 🙂 . incase any reply helps you to gain knowledge, an upvote would be appreciated to build Community stronger.
🙂 KV
- Mark as New
- Bookmark Message
- Subscribe to Message
- Mute Message
- Subscribe to RSS Feed
- Permalink
- Report Inappropriate Content
@kamlesh_vaghela I was using the condition "result.count'!= "0""
but, in the queries that there were no results found , the panel was showing the message : "Search is waiting for input"
and I thought that it would be confusing for people to understand, so I've changed to 'result.count'!= "0No event for this table""
In theory, it would do the same, but in my panel it would show 'no result found' which is more understandable.
let me try to change back to result.count'!= "0" and try again
- Mark as New
- Bookmark Message
- Subscribe to Message
- Mute Message
- Subscribe to RSS Feed
- Permalink
- Report Inappropriate Content
@kamlesh_vaghela let me know if you need something more, please? I dont have anything more in my dashboard than this.
- Mark as New
- Bookmark Message
- Subscribe to Message
- Mute Message
- Subscribe to RSS Feed
- Permalink
- Report Inappropriate Content
Hello @kamlesh_vaghela
thanks for replying me. so, I tried this, but I continue with the same problem which is that I have to CLICK in the number , in order to show me the details inside the 'Information Table' in the bottom.
I'd like the results would go there WITHOUT clicking if the count != 0
IF I add this condition here:
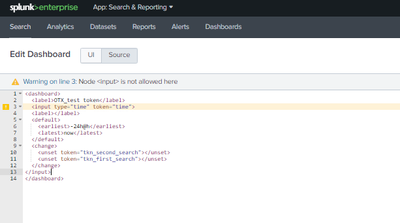
Besides I have to CLICK in the number to the results show up in the "information table' , what happened is when I click the SEARCH window opens to me 😞
- Mark as New
- Bookmark Message
- Subscribe to Message
- Mute Message
- Subscribe to RSS Feed
- Permalink
- Report Inappropriate Content
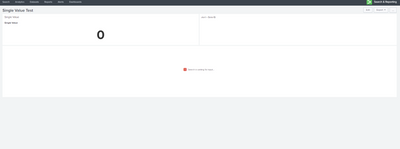
Can you please try this sample example ?
<dashboard>
<label>Single Value Test</label>
<row>
<panel>
<title>Single Value</title>
<single>
<title>Single Value</title>
<search>
<done>
<condition match="'result.count'!= "0"">
<set token="alert">| makeresults | eval msg="Hello"</set>
</condition>
<condition>
<unset token="alert"></unset>
</condition>
</done>
<query>| makeresults | eval count=0 | table count</query>
<earliest>$earliest$</earliest>
<latest>$latest$</latest>
</search>
<option name="drilldown">none</option>
<option name="refresh.display">progressbar</option>
</single>
</panel>
<panel>
<html>
alert = $alert$
</html>
</panel>
</row>
<row>
<panel>
<table>
<search>
<query>$alert$</query>
<earliest>-24h@h</earliest>
<latest>now</latest>
</search>
<option name="drilldown">none</option>
</table>
</panel>
</row>
</dashboard>
Thanks
KV
▄︻̷̿┻̿═━一
If any of my reply helps you to solve the problem Or gain knowledge, an upvote would be appreciated.
- Mark as New
- Bookmark Message
- Subscribe to Message
- Mute Message
- Subscribe to RSS Feed
- Permalink
- Report Inappropriate Content
Have you tried this in drilldown?
<drilldown>
            <condition match="'click.value'!= 0">
               <set token="alert"> MY SEARCH</set>
            </condition>
            <condition>
              <unset token="alert"></unset>
            </condition>
        </drilldown>
Thanks
KV
▄︻̷̿┻̿═━一
If any of my reply helps you to solve the problem Or gain knowledge, an upvote would be appreciated.
- Mark as New
- Bookmark Message
- Subscribe to Message
- Mute Message
- Subscribe to RSS Feed
- Permalink
- Report Inappropriate Content
- Mark as New
- Bookmark Message
- Subscribe to Message
- Mute Message
- Subscribe to RSS Feed
- Permalink
- Report Inappropriate Content
Yes @Luciana
This is sample dashboard. You can use the same login in your dashboard. Please let us know if you found any difficulties 🙂
Thanks
KV
▄︻̷̿┻̿═━一
If any of my reply helps you to solve the problem Or gain knowledge, an upvote would be appreciated.
- Mark as New
- Bookmark Message
- Subscribe to Message
- Mute Message
- Subscribe to RSS Feed
- Permalink
- Report Inappropriate Content
- Mark as New
- Bookmark Message
- Subscribe to Message
- Mute Message
- Subscribe to RSS Feed
- Permalink
- Report Inappropriate Content
Hi @kamlesh_vaghela , How are you?
look, I am considering that I cant do what I want because drilldown always will be requiring that user clicks.
but actually , what I want is IF the search stats count >=1 then, a second search would be trigger and then, in this search I could use the sendemail command to send me alert with more information
so, considering first query:
index = xxx sourcetype=xxx action=Allowed [|inputlookup OTX | search type=URL | rename indicator as url | table url] |dedup user |stats count
<condition match="$result.resultCount$>1">
then run a second query:
index = xxx sourcetype=xxx action=Allowed [|inputlookup OTX | search type=domain OR type=hostname | rename indicator as hostname | table hostname]
|dedup user |table _time, hostname, domain, user, serverip, ClientIP |sendemail to="myemail.co.nz" server=smtp.server.co.nz subject="Notification - IOC found by url" message="This is an test message" sendresults=true inline=true format=csv
Do you know if is possible, or How Can I do this?
I thought about set a token with
<condition match="$result.resultCount$>1">
but then , I dont know how to trigger a second search if the condition is true.
Thank you so much
- Mark as New
- Bookmark Message
- Subscribe to Message
- Mute Message
- Subscribe to RSS Feed
- Permalink
- Report Inappropriate Content
or in another words...
How to trigger second search based on first search where condition is : first result count >=1
- Mark as New
- Bookmark Message
- Subscribe to Message
- Mute Message
- Subscribe to RSS Feed
- Permalink
- Report Inappropriate Content
By setting and unsetting token, you can trigger search to execute it.
Check below example, Here tkn_second_search is set when first search have some count. Please try this XML and let me know if any issue.
<dashboard>
<label>Single Value Test</label>
<search id="first_search">
<query>index = xxx sourcetype=xxx action=Allowed [|inputlookup OTX | search type=URL | rename indicator as url | table url] |dedup user |stats count
</query>
<done>
<condition match="'result.count'!= "0"">
<set token="tkn_second_search">
index = xxx sourcetype=xxx action=Allowed [|inputlookup OTX | search type=domain OR type=hostname | rename indicator as hostname | table hostname]
|dedup user |table _time, hostname, domain, user, serverip, ClientIP |sendemail to="myemail.co.nz" server=smtp.server.co.nz subject="Notification - IOC found by url" message="This is an test message" sendresults=true inline=true format=csv
</set>
</condition>
<condition>
<unset token="tkn_second_search"></unset>
</condition>
</done>
</search>
<row>
    <panel>
      <html>
        Second Search Token = $tkn_second_search$
      </html>
    </panel>
  </row>
<row>
<panel>
<table>
<search>
<query>$tkn_second_search$</query>
<earliest>-24h@h</earliest>
<latest>now</latest>
</search>
<option name="drilldown">none</option>
</table>
</panel>
</row>
</dashboard>
My Sample XML:
<dashboard>
<label>Dependent Search Example</label>
<search id="first_search">
<query>| makeresults | eval count=1 | table count</query>
<done>
<condition match="'result.count'!= "0"">
<set token="tkn_second_search">| makeresults | eval msg="Hello"</set>
</condition>
<condition>
<unset token="tkn_second_search"></unset>
</condition>
</done>
</search>
<row>
<panel>
<html>
Second Search Token = $tkn_second_search$
</html>
</panel>
</row>
<row>
<panel>
<table>
<search>
<query>$tkn_second_search$</query>
<earliest>-24h@h</earliest>
<latest>now</latest>
</search>
<option name="drilldown">none</option>
</table>
</panel>
</row>
</dashboard>
Thanks
KV
▄︻̷̿┻̿═━一
If any of my reply helps you to solve the problem Or gain knowledge, an upvote would be appreciated.
- Mark as New
- Bookmark Message
- Subscribe to Message
- Mute Message
- Subscribe to RSS Feed
- Permalink
- Report Inappropriate Content
@kamlesh_vaghela I hope you are having a good day! so, I've tried and it worked, now every time the first query has a result count > 0 the second search triggers and send an email 🙂
Can I confirm with you if I understood right the idea of: result.count'!= "0""
( in case there are no results >=0, then it will show no results found?)
I thought about using the same logic for all queries in my dashboard, then, as for an example, I did a test in 3 queries , however in the query that we dont have any IOC is found (hits by URL - $tkn_first_search$) , it is appearing for me " search is waiting for input"
not sure is this is associated or not.
- Mark as New
- Bookmark Message
- Subscribe to Message
- Mute Message
- Subscribe to RSS Feed
- Permalink
- Report Inappropriate Content
Below code is just for Debugging purpose. You can remove it.
<row>
<panel>
<html>
Second Search Token = $tkn_second_search$
</html>
</panel>
</row>
Just use depends If you don't want to show panel with when token is not set. see below code.
<row>
    <panel depends="$tkn_second_search$">
      <table>
        <search>
          <query>$tkn_second_search$</query>
          <earliest>-24h@h</earliest>
          <latest>now</latest>
        </search>
        <option name="drilldown">none</option>
      </table>
    </panel>
  </row>
Thanks
KV
▄︻̷̿┻̿═━一
If any of my reply helps you to solve the problem Or gain knowledge, an upvote would be appreciated.
- Mark as New
- Bookmark Message
- Subscribe to Message
- Mute Message
- Subscribe to RSS Feed
- Permalink
- Report Inappropriate Content
@kamlesh_vaghela thanks for all your help and I swear that is my last message🙂
I've just changed the condition for : <condition match="'result.count'!= "0No event for this table""> then it will show 'no results count. 🙂
now, I am trying to add all my query results in ONE panel. I was checking your answer in the following https://community.splunk.com/t5/Dashboards-Visualizations/How-to-add-two-query-results-in-xml-dashbo...
but, I m not sure if I can use 2 different tokens (condition match that triggers my second query) and ($job.sid$) for the first query
Can you just confirm?
- Mark as New
- Bookmark Message
- Subscribe to Message
- Mute Message
- Subscribe to RSS Feed
- Permalink
- Report Inappropriate Content
- Mark as New
- Bookmark Message
- Subscribe to Message
- Mute Message
- Subscribe to RSS Feed
- Permalink
- Report Inappropriate Content
ok @kamlesh_vaghela I will try to set different tokens. 🙂
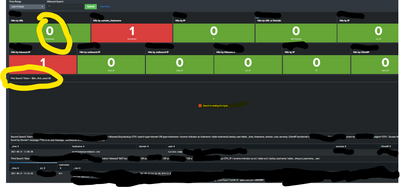
Have you noticed that in the solution that you helped me has a little issue... once we set that token, the SECOND SEARCH will not run a second time if the FIRST SEARCH runs again? Do you know How Can I get this around?
for example, the stats count that was in RED changed to green, which means 0 IOCs found, but the bottom panel continues to show me the oldest result .


