- Splunk Answers
- :
- Using Splunk
- :
- Splunk Search
- :
- Splunk app for AWS security dashboard shows '0' da...
- Subscribe to RSS Feed
- Mark Topic as New
- Mark Topic as Read
- Float this Topic for Current User
- Bookmark Topic
- Subscribe to Topic
- Mute Topic
- Printer Friendly Page
- Mark as New
- Bookmark Message
- Subscribe to Message
- Mute Message
- Subscribe to RSS Feed
- Permalink
- Report Inappropriate Content
Splunk app for AWS security dashboard shows '0' data
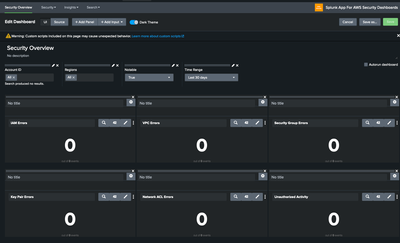
Splunk app for AWS security dashboard shows '0' data, need help to fix this issue
when I try to run/edit query shows error as below
- Mark as New
- Bookmark Message
- Subscribe to Message
- Mute Message
- Subscribe to RSS Feed
- Permalink
- Report Inappropriate Content
Hey @Gaikwad,
The error message itself shows what the issue is. The dashboards in the Splunk App for AWS Security are powered by the macro "aws-security-cloudtrail-service". By default, the macro definition is present in the app. However, it doesn't know what index to look into. You can navigate to Settings -> Advanced Search -> Search Macros and locate the macro in the window. Then you'll need to define what index does it need to search to and add the arguments accordingly.
In addition to this, you'll also need to make sure that the permissions to the macro are adequate for a user to access it outside the app or should at least have read access to all the users for the dashboard to load the panels properly. Once the macro is defined with the appropriate index definition and the permissions are properly provided, the dashboard panels will show the expected results.
Thanks,
Tejas.
---
If the above solution is helpful, an upvote is appreciated.
- Mark as New
- Bookmark Message
- Subscribe to Message
- Mute Message
- Subscribe to RSS Feed
- Permalink
- Report Inappropriate Content
- Mark as New
- Bookmark Message
- Subscribe to Message
- Mute Message
- Subscribe to RSS Feed
- Permalink
- Report Inappropriate Content
Hey @Gaikwad ,
I think this is a custom macro created by you. The default dashboards in the app uses a few macros that comes shipped with the app itself. You can change the filter from Visible in the app to Created in the app and you'll be able to identify a list of macros that comes by default.
For example for the first panel to display IAM errors, it looks for the following macro: aws-security-cloudtrail-service("IAM", $notable$).
The macro applies the lookup command and fetches the values from aws_security_all_eventName lookup file. Below is it's definition from the app.
lookup aws_security_all_eventName eventName OUTPUT function | fillnull value="N/A" function | search function="$service$" | eval notable=if(match(eventName, "(^Get*|^List*|^Describe*)"), 0, 1) | search notable=$notable$
Similarly, the further panels would be using few other macros and populating the panels. You'll need to check those macro definitions and update them as per your environment. That should help you load the dashboard properly.
Thanks,
Tejas.


