Are you a member of the Splunk Community?
- Find Answers
- :
- Using Splunk
- :
- Splunk Search
- :
- [Solution] Dashboard global_time token value not s...
- Subscribe to RSS Feed
- Mark Topic as New
- Mark Topic as Read
- Float this Topic for Current User
- Bookmark Topic
- Subscribe to Topic
- Mute Topic
- Printer Friendly Page
- Mark as New
- Bookmark Message
- Subscribe to Message
- Mute Message
- Subscribe to RSS Feed
- Permalink
- Report Inappropriate Content
[Solution] Dashboard global_time token value not set
For the search record:
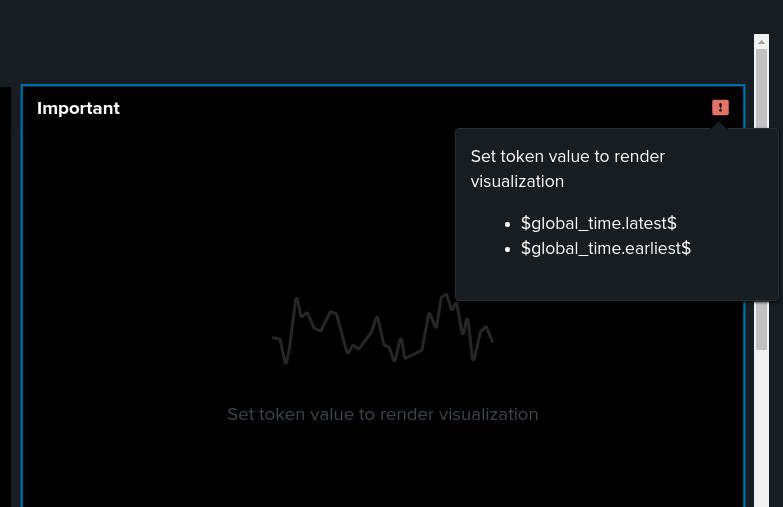
I edited an already functional dashboard in the studio, tweaking the layout. Part of that was deleting and relocating the Time Input. Afterwards I was seeing this weirdness on all of the charts:
That started a "what does it mean and where is it coming from" search, eventually becoming an expert in the concept of Splunk tokens.
The problem was the re-insertion of the Time Input had it put into the wrong area of the dashboard. The solution was to edit the Source of the dashboard and cut and paste the defaults section out of the visualization section that it had been put into, and back into the top section.
"defaults": {
    "dataSources": {
        "ds.search": {
            "options": {
                "queryParameters": {
                    "latest": "$global_time.latest$",
                    "earliest": "$global_time.earliest$"
                }
            }
       }
    }
},
Additionally the name of the token had been modded to the intuitive value of tr_txndYpSb when putting back the Time Input so it needed to be changed back to global_time. Once that was done, the dashboard charts worked again.
"inputs": {
    "input_inmCH1Lw": {
        "options": {
            "defaultValue": "-7d@h,now",
            "token": "tr_txndYpSb"
        },
        "title": "Time Range Input Title",
        "type": "input.timerange"
    }
},

