- Find Answers
- :
- Using Splunk
- :
- Splunk Search
- :
- [SmartStore] How is the Replication of Summary buc...
- Subscribe to RSS Feed
- Mark Topic as New
- Mark Topic as Read
- Float this Topic for Current User
- Bookmark Topic
- Subscribe to Topic
- Mute Topic
- Printer Friendly Page
- Mark as New
- Bookmark Message
- Subscribe to Message
- Mute Message
- Subscribe to RSS Feed
- Permalink
- Report Inappropriate Content
[SmartStore] How is the Replication of Summary bucket managed in Splunk Smartstore?
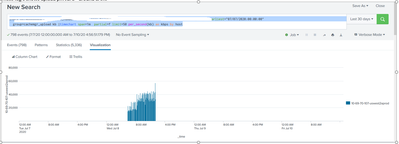
there has been a huge spike in the number of uploads, resulting in many more failed uploads from throttling than we had before.
It is currently unclear to me what caused this. Whether constant retries are underlying the huge spike, or some new data being uploaded have caused this. The bucket size has remained pretty constant, but the number of daily uploads has gone from about 80k to 4 million.
Looking at some of s3 access logs, it seems like search objects are getting uploaded?
Most of these uploads are for "ra" (Report Acceleration bucket)
index=_internal host=<XXX> sourcetype=splunkd action=upload status=succeeded NOT cacheId=ra* | rex field=cacheId "bid\|(?<indexname>\w+)\~\w+\~" | timechart span=1m partial=f limit=50 per_second(kb) as kbps by indexname
index=_internal host=<XXX> sourcetype=splunkd action=upload status=succeeded NOT cacheId=ra* | rex field=cacheId "bid\|(?<indexname>\w+)\~\w+\~" | timechart span=1m partial=f limit=50 per_second(kb) as kbps by indexname
- Mark as New
- Bookmark Message
- Subscribe to Message
- Mute Message
- Subscribe to RSS Feed
- Permalink
- Report Inappropriate Content
For indexer cluster, the summary is created on the peer node that is primary for the associated bucket or buckets. The peer then uploads the summary to remote storage. When a peer needs the summary, its cache manager fetches the summary from remote storage.
Summary replication between peers is not needed and the uploaded summary is available to all peer nodes.
Here is an example from my env that shows Report Acceleration bucket on remote store.
[root@centos65-64sup02 rbal]#$SPLUNK_HOME/bin/splunk cmd splunkd rfs -- ls --starts-with index:main | grep -v '/db/'
#for full paths run: splunkd rfs -- ls --starts-with volume:my_s3_vol/main/
size,name
1080,main/ra/38/01/16~3D41EF74-A16D-421D-9FD7-83B3849101B2/3F3F537C-7DAD-4CF8-B062-168D17BC15C7_search_admin_NS16c348adc086860d/guidSplunk-3D41EF74-A16D-421D-9FD7-83B3849101B2/metadata.csv
75,main/ra/38/01/16~3D41EF74-A16D-421D-9FD7-83B3849101B2/3F3F537C-7DAD-4CF8-B062-168D17BC15C7_search_admin_NS16c348adc086860d/guidSplunk-3D41EF74-A16D-421D-9FD7-83B3849101B2/metadata_checksum
NOTE: In this example, the "guidSplunk-3D41EF74-A16D-421D-9FD7" is the GUID of the search head where data is accelerated.
so in my case based on the report Accelerated search and time range only the relevant buckets were accelerated.
Splunk has an open bug where SPL-186425:S2: Rebuilding an evicted DMA summary causes us to re-upload the old tsidx file with the newly rebuilt one. This means that we would see upload/download of the bucket when buckets are being accelerated.
As per this JIRA: When rebuilding an evicted DMA summary, for some reason we localize the remote copy first and in parallel, we begin to rebuild the summary on disk.
For the graph posted the upload activity was due to report acceleration
03A227A6-442C-4EC2-96BA-EDB3AEBCB2DF_XXXX_commerce_products_emmett_NSab5a2628876cea87
03A227A6-442C-4EC2-96BA-EDB3AEBCB2DF_XXXX_partnerships_jamesw_NS9c8a6f5149bf222c
To get the name of the corresponding Splunk report uses the REST endpoint on the search head.
| rest servicesNS/-/-/admin/summarization
|table saved_searches.admin;search;test_support_ra.name,summary.hash,summary.earliest_time,summary.complete,summary.id, summary.complete,summary.id


