Are you a member of the Splunk Community?
- Find Answers
- :
- Using Splunk
- :
- Splunk Search
- :
- Need help on Dashboard related issue
- Subscribe to RSS Feed
- Mark Topic as New
- Mark Topic as Read
- Float this Topic for Current User
- Bookmark Topic
- Subscribe to Topic
- Mute Topic
- Printer Friendly Page
- Mark as New
- Bookmark Message
- Subscribe to Message
- Mute Message
- Subscribe to RSS Feed
- Permalink
- Report Inappropriate Content
Need help on Dashboard related issue
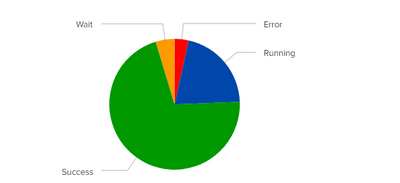
I have a dashboard in which there is a Pie chart like below
I need help in this way that it has to show a label of event count and also the color details like green for success, blue for running, red for error, Orange for Wait. It has to mention the details and also the event count.
Also need help on the below issue for the bar chart.
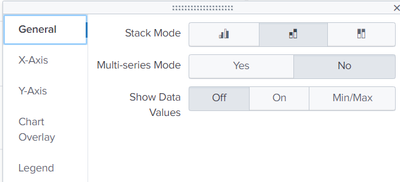
In the above chart there are multiple columns with different colors for a single day. For this there should be a single column with different colors for single. Can someone please help me out on this.
- Mark as New
- Bookmark Message
- Subscribe to Message
- Mute Message
- Subscribe to RSS Feed
- Permalink
- Report Inappropriate Content
Do you mean stacked mode?
- Mark as New
- Bookmark Message
- Subscribe to Message
- Mute Message
- Subscribe to RSS Feed
- Permalink
- Report Inappropriate Content
Hi @Renunaren,
the only way to have a legend with the values is to create another panel containing the same search (and results) in table format.
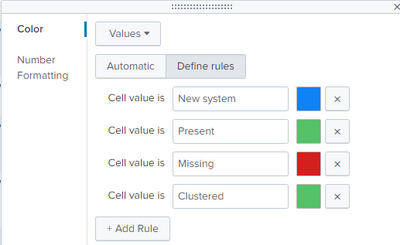
About colours, if the values are fixed (e.g. success, running, error, Wait, etc...) you can assign a values from the GUI, on the table clicking on the pen in the right high corner of the column:
On the chart using the charting.fieldColors option:
    <option name="charting.fieldColors">
      {"ERROR": 0xFF0000, "WARN": 0xFF9900, "INFO":0x0066FF, "NULL":0xC4C4C0}
    </option>
Ciao.
Giuseppe
- Mark as New
- Bookmark Message
- Subscribe to Message
- Mute Message
- Subscribe to RSS Feed
- Permalink
- Report Inappropriate Content
Hi If possible can you please provide me a better solution for the issue merging of two columns in a column chart into a single chart


