Join the Conversation
- Find Answers
- :
- Using Splunk
- :
- Splunk Search
- :
- [Need help] command "bin span=1d _time" doesn't sp...
- Subscribe to RSS Feed
- Mark Topic as New
- Mark Topic as Read
- Float this Topic for Current User
- Bookmark Topic
- Subscribe to Topic
- Mute Topic
- Printer Friendly Page
- Mark as New
- Bookmark Message
- Subscribe to Message
- Mute Message
- Subscribe to RSS Feed
- Permalink
- Report Inappropriate Content
[Need help] command "bin span=1d _time" doesn't split stats count by day.
Hi team,
1. I have below query
<base query here>
| rex field=_raw "POST\s+(?<RequestURL>.*)HTTP.*company\=(?<CMID>.*?)\&"
| eval autosave=if(RequestURL like "%autosave=true%", "1", "0")
| bin span=1d _time
| stats count(eval(autosave=1)) as autosave count(eval(autosave=0 OR autosave=1)) as total by _time,SFDC
| eval percent=round(autosave * 100 / total,2)
| chart values(total) as total values(autosave) as autosave values(percent) as percent by _time, SFDC
| ......
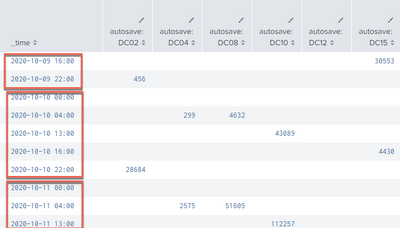
2. but the table returned to me is not formtted with what I sepcified in above query "bin span=1d _time", the table has two rows for each day, which is not what i want. please refer to below screenshot.
3. here is expected result i want. how to modify the query to achive expected result?
- Mark as New
- Bookmark Message
- Subscribe to Message
- Mute Message
- Subscribe to RSS Feed
- Permalink
- Report Inappropriate Content
You get a row for each unique combination of fields, in your case _time and SFDC
- Mark as New
- Bookmark Message
- Subscribe to Message
- Mute Message
- Subscribe to RSS Feed
- Permalink
- Report Inappropriate Content
but i specify span=1d, why the stats result is not split by a day?
I tried with by _ time only, and remove SFDC after by clause. the stats result is still not returned by day. As you see from 1st screenshot, same date still appeared multiple times.
Thanks,
Cherie
- Mark as New
- Bookmark Message
- Subscribe to Message
- Mute Message
- Subscribe to RSS Feed
- Permalink
- Report Inappropriate Content
| stats values(*) as * by _time- Mark as New
- Bookmark Message
- Subscribe to Message
- Mute Message
- Subscribe to RSS Feed
- Permalink
- Report Inappropriate Content
Hi @ITWhisperer and @isoutamo ,
I change span=1d to span=24h, and not the table split the data by day. please refer to below screenshot.
I think span=1d and span=24h are same. why they ouput different result?
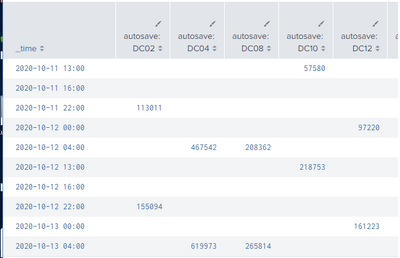
1. with span=24h (this is what i want to get.)
2. with span=1d (this is what I don't want to get as same day appears multiple times.)
- Mark as New
- Bookmark Message
- Subscribe to Message
- Mute Message
- Subscribe to RSS Feed
- Permalink
- Report Inappropriate Content
Please show the queries you used for the two screenshots
As for different results, span=1d will snap to the day and span=24h will snap to the hour, so if you time range starts at 07:10 on 2020/10/09 and finished at 20:32 on 2020/10/12, with span=1d your first bin will include results from 07:10 on 2020/10/09 until 23:59:59 on 2020/10/09 and the second bin starts at 00:00 on 2020/10/10 until 23:59:59 on 2020/10/10 etc. whereas with span=24h your first bin will include results from 07:10 on 2020/10/09 until 06:59:59 on 2020/10/10 and the second bin starts at 07:00 on 2020/10/10 until 06:59:59 on 2020/10/11
- Mark as New
- Bookmark Message
- Subscribe to Message
- Mute Message
- Subscribe to RSS Feed
- Permalink
- Report Inappropriate Content
Hi @ITWhisperer
Here are the queries for two screenshots.
1. query with span=1d and result screenshot. Time Range for these 2 queries are both ' 2 days before' that I selected from from time range picker.
(host=pc* OR servername=pc*) AND
(( index=*bizx_web sourcetype=access_log_bizx AND "POST /acme?acme_form_type=pm360&itrModule=talent&_s.crb=*" )
OR ( index=*bix_application sourcetype=server_log_bizx AND SaveFormImpl "Total Time for createDetailedRecords" ))
| rex field=_raw "POST\s+(?<RequestURL>.*)HTTP.*company\=(?<CMID>.*?)\&"
| eval autosave=if(RequestURL like "%autosave=true%", "1", "0")
| bin span=1d _time
| stats count(eval(autosave=1)) as autosave count(eval(autosave=0 OR autosave=1)) as total by _time SFDC
| eval percent=round(autosave * 100 / total,2)
| chart values(total) as total values(autosave) as autosave values(percent) as percent by _time SFDC useother=false limit=0
As you see , the stats count result is not splitted by a day. Looks like it was splitted by hours.
2. query with span=24h and result screenshot is
(host=pc* OR servername=pc*) AND
(( index=*bizx_web sourcetype=access_log_bizx AND "POST /acme?acme_form_type=pm360&itrModule=talent&_s.crb=*" )
OR ( index=*bix_application sourcetype=server_log_bizx AND SaveFormImpl "Total Time for createDetailedRecords" ))
| rex field=_raw "POST\s+(?<RequestURL>.*)HTTP.*company\=(?<CMID>.*?)\&"
| eval autosave=if(RequestURL like "%autosave=true%", "1", "0")
| bin span=24h _time
| stats count(eval(autosave=1)) as autosave count(eval(autosave=0 OR autosave=1)) as total by _time SFDC
| eval percent=round(autosave * 100 / total,2)
| chart values(total) as total values(autosave) as autosave values(percent) as percent by _time SFDC useother=false limit=0
- Mark as New
- Bookmark Message
- Subscribe to Message
- Mute Message
- Subscribe to RSS Feed
- Permalink
- Report Inappropriate Content
Hi @cheriemilk
I am unable to replicate your results. Please check that you are using the latest version of splunk and if the problem still occurs, raise a support request with splunk.
- Mark as New
- Bookmark Message
- Subscribe to Message
- Mute Message
- Subscribe to RSS Feed
- Permalink
- Report Inappropriate Content
r. Ismo
- Mark as New
- Bookmark Message
- Subscribe to Message
- Mute Message
- Subscribe to RSS Feed
- Permalink
- Report Inappropriate Content
https://docs.splunk.com/Documentation/Splunk/8.0.6/Search/Specifytimemodifiersinyoursearch
r. Ismo
- Mark as New
- Bookmark Message
- Subscribe to Message
- Mute Message
- Subscribe to RSS Feed
- Permalink
- Report Inappropriate Content
time selection is '7 days before' selected from time range picker. i didn't add 'earliest= xx' in the query.


