Join the Conversation
- Find Answers
- :
- Using Splunk
- :
- Splunk Search
- :
- Legend in Pie Chart Dashboard
- Subscribe to RSS Feed
- Mark Topic as New
- Mark Topic as Read
- Float this Topic for Current User
- Bookmark Topic
- Subscribe to Topic
- Mute Topic
- Printer Friendly Page
- Mark as New
- Bookmark Message
- Subscribe to Message
- Mute Message
- Subscribe to RSS Feed
- Permalink
- Report Inappropriate Content
I made a dashboard which has 2 pie charts and their status codes. How do I include a legend showing what the status codes mean?
Example, one pie chart shows only 3 status codes so far for today (200, 400, and 699).
status code = 200 means a successful web service call
status code = 400 means an unsuccessful web service call
status code = 699 means failed payment method
I want a legend to show up which gives a description of what the status codes represent so anyone looking at the dashboard could instantly know without having to go ask or look it up
- Mark as New
- Bookmark Message
- Subscribe to Message
- Mute Message
- Subscribe to RSS Feed
- Permalink
- Report Inappropriate Content
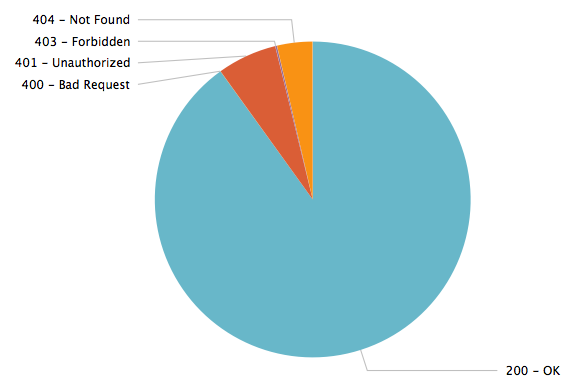
I did something similar, but instead of a legend I modified the fields that the pie chart was displaying.
I started with a simple lookup table to map to my status codes:
status,description
200,OK
400,Bad Request
401,Unauthorized
403,Forbidden
404,Not Found
500,Internal Server Error
501,Not Implemented
502,Bad Gateway
503,Service Unavailable
504,Gateway Timeout
505,HTTP Version Not Supported
There is also an http_status.csv file available on the Splunk Wiki: http://wiki.splunk.com/Http_status.csv
Next I just mapped the description to the status codes:
<query to get status codes> | stats count by status | lookup http_status status as status OUTPUT description
Then I created a new field that combines the status and the description and dumped it in a table with the count:
| eval status_description = status + " - " + description | table status_description, count
Now when you view the pie chart, you will get something like this:
Side note: If you didn't want to use a lookup table and only had a few status codes you wanted to display, you could also use a case statement to create your custom fields:
| eval status_description = case(status=200, "200 - Successful web service call", status=400, "400 - Unsuccessful web service call", status=669, "Failed payment method")

