- Mark as New
- Bookmark Message
- Subscribe to Message
- Mute Message
- Subscribe to RSS Feed
- Permalink
- Report Inappropriate Content
Hi Splunk Gurus,
Hoping someone out there might be able to provide some assistance with this one.
I have a requirement to be able to display a count of sales per hr for the last 24 hrs (with flexibility to adjust that as needed), but also to show the average sales per hr for the last 30 days as an overlay.
First bit is easy, second bit has me stumped. Have spent the last hr going through various posts looking or solutions, but nothing quite right for my situation.
Initial search would be something like this:
index=* source=flow_stage*order_header
          | timechart span=1h count AS SalesPerHr by WebsiteCountry
giving a graph like this:
What I need to add is the overlay line that shows the average sales per hr based on the last 30 days sales data.
Hopefully this is clear - any help gratefully appreciated!
EDIT:
As requested - some sample data (does not contain all fields as some contain sensitive data).
2019-02-22 07:21:14.823, order_no="AU02051432", nav_order_no="AU02051432", order_date="2019-02-21 20:17:13.0", invoice_no="07324912", customer_no="CA06908192", newsletter_subscription="0", currency="AUD", total_net_price="127.22", total_tax="12.73", total_gross_price="139.95", dw_order_filename="Order_AU02051432.xml", merchandize_total_net_price="115.45", merchandize_total_tax="11.55", merchandize_total_gross_price="127.0", adj_merchandize_total_net_price="115.45", adj_merchandize_total_tax="11.55", adj_merchandize_total_gross_price="127.0", status="0", inserted="2019-02-22 07:21:14.823", updated="2019-02-22 07:22:03.0", status_shipping="NOT_SHIPPED"
2019-02-22 07:01:17.127, order_no="AU02051484", nav_order_no="AU02051484", order_date="2019-02-21 19:51:16.0", invoice_no="07325413", customer_no="CA06908750", newsletter_subscription="0", currency="AUD", total_net_price="83.59", total_tax="8.36", total_gross_price="91.95", dw_order_filename="Order_AU02051484.xml", merchandize_total_net_price="71.82", merchandize_total_tax="7.18", merchandize_total_gross_price="79.0", adj_merchandize_total_net_price="71.82", adj_merchandize_total_tax="7.18", adj_merchandize_total_gross_price="79.0", status="0", inserted="2019-02-22 07:01:17.127", updated="2019-02-22 07:02:04.0", status_shipping="NOT_SHIPPED"
2019-02-22 06:51:13.643, order_no="AU02051483", nav_order_no="AU02051483", order_date="2019-02-21 19:39:23.0", invoice_no="07325412", customer_no="CA06908749", newsletter_subscription="0", currency="AUD", total_net_price="252.72", total_tax="25.28", total_gross_price="278.0", dw_order_filename="Order_AU02051483.xml", merchandize_total_net_price="252.72", merchandize_total_tax="25.28", merchandize_total_gross_price="278.0", adj_merchandize_total_net_price="252.72", adj_merchandize_total_tax="25.28", adj_merchandize_total_gross_price="278.0", status="0", inserted="2019-02-22 06:51:13.643", updated="2019-02-22 06:52:03.0", status_shipping="NOT_SHIPPED"
- Mark as New
- Bookmark Message
- Subscribe to Message
- Mute Message
- Subscribe to RSS Feed
- Permalink
- Report Inappropriate Content
You can use addtotals and eventstats after your timechart command to compute the average of the SalesPerHr field. I suggest adding an index to your search to optimize performance. Here is the syntax you will need
index=your_index_here source=flow_stage*order_header
| timechart span=1h count AS SalesPerHr by WebsiteCountry
| addtotals
| eventstats avg(Total) as average
| fields - total
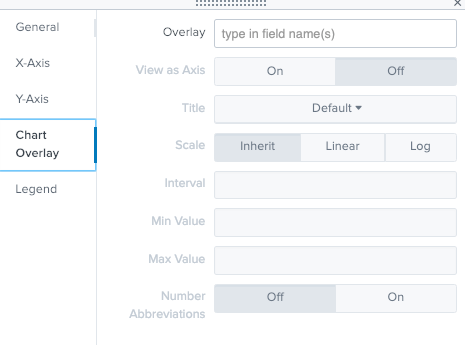
Then on the visualization tab select Format > Chart Overlay and select "average" as your overlay field
- Mark as New
- Bookmark Message
- Subscribe to Message
- Mute Message
- Subscribe to RSS Feed
- Permalink
- Report Inappropriate Content
Hi @pkeenan87,
Thanks for your response.
I have tested this but it doesn't work. In the chart overly area, I get a overlay value of "Null" which when I select only gives me the average line (which is also I'm assuming is also only based on the same period that the report is run for??), no longer shows the bars for each hr.
- Mark as New
- Bookmark Message
- Subscribe to Message
- Mute Message
- Subscribe to RSS Feed
- Permalink
- Report Inappropriate Content
@kozanic_FF Whoops, sorry about that. Because you are using timechart we will need to add the totals first before we can compute the average. I have updated my post accordingly
- Mark as New
- Bookmark Message
- Subscribe to Message
- Mute Message
- Subscribe to RSS Feed
- Permalink
- Report Inappropriate Content
Thanks @pkeenan87 ,
A minor tweak - change "- total" to "- NULL" and this works now.
While this is great if I just wanted to add the sales average for the report range, I need to be able to show the Sales Per Hour Average for the last 30 days on the overly.
Any thoughts on how I might achieve this?
- Mark as New
- Bookmark Message
- Subscribe to Message
- Mute Message
- Subscribe to RSS Feed
- Permalink
- Report Inappropriate Content
Thats a little tricky, give this a try:
index=your_index_here source=flow_stage*order_header
| timechart span=1h count AS SalesPerHr by WebsiteCountry
| eval date_hour = strftime(_time, "%H")
| join date_hour [
search earliest=-30d index=your_index_here source=flow_stage*order_header
| timechart span=1h count
| eval date_hour = strftime(_time, "%H")
| stats avg(count) as average by date_hour
| eval average = round(average)
| fields date_hour average ]
| fields - date_hour
- Mark as New
- Bookmark Message
- Subscribe to Message
- Mute Message
- Subscribe to RSS Feed
- Permalink
- Report Inappropriate Content
Thanks @pkeenan87, that seems to be exactly what I was after!
- Mark as New
- Bookmark Message
- Subscribe to Message
- Mute Message
- Subscribe to RSS Feed
- Permalink
- Report Inappropriate Content
So this overlay should be a flat line with average sales per hour for all countries and all hours (single values)??
- Mark as New
- Bookmark Message
- Subscribe to Message
- Mute Message
- Subscribe to RSS Feed
- Permalink
- Report Inappropriate Content
Hi @somesoni2,
what I'd like is a moving line that for each hr, shows the average sales for that hr in the last 30 days, based on total sales for that hr.
The line would go up and down in accordance with hourly average.
- Mark as New
- Bookmark Message
- Subscribe to Message
- Mute Message
- Subscribe to RSS Feed
- Permalink
- Report Inappropriate Content
Could you please share some sample events?


